| Red | Green | Blue | |
| z | 17.64 | ||
| znorm | Inf | ||
| sky | -Inf | -Inf | -Inf |
| S/N | 35.4 | 53.2 | 58.0 |
| S/N(c) | 0.0 | 0.0 | 0.0 |
| SN(E/C) |
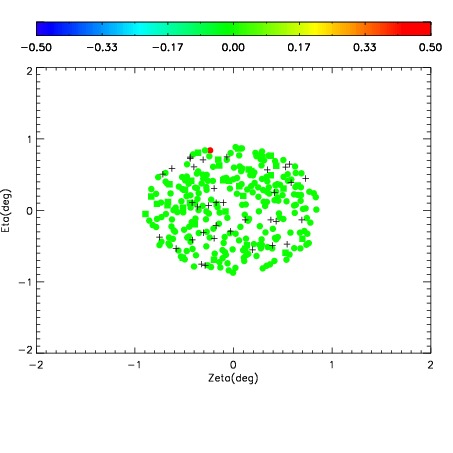
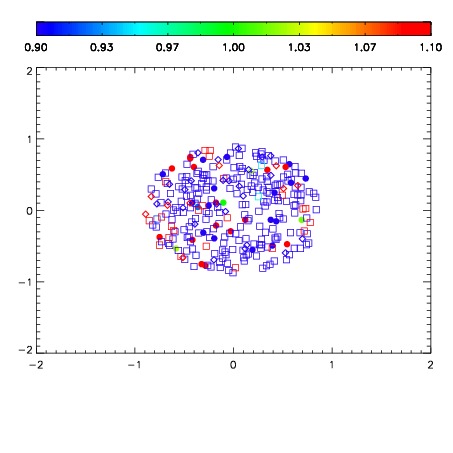
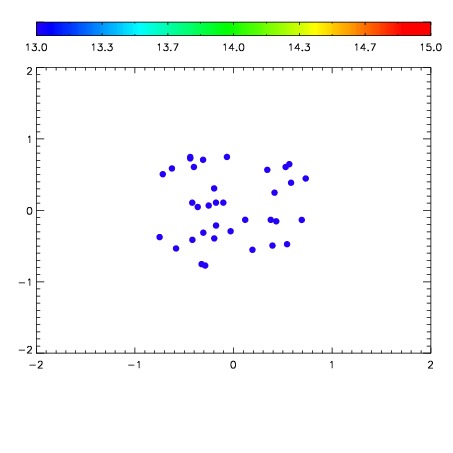

| Frame | Nreads | Zeropoints | Mag plots | Spatial mag deviation | Spatial sky 16325A emission deviations (filled: sky, open: star) | Spatial sky continuum emission | Spatial sky telluric CO2 absorption deviations (filled: H < 10) | |||||||||||||||||||||||
| 0 | 0 |
|
|
|
|
|
|
| IPAIR | NAME | SHIFT | NEWSHIFT | S/N | NAME | SHIFT | NEWSHIFT | S/N |
| 0 | 08180051 | 0.506974 | 0.00000 | 207.576 | 08180048 | -0.000904457 | 0.507878 | 208.577 |
| 1 | 08180047 | 0.505308 | 0.00166601 | 207.540 | 08180049 | -0.00239460 | 0.509369 | 207.567 |
| 2 | 08180050 | 0.498189 | 0.00878498 | 207.477 | 08180052 | -0.00143470 | 0.508409 | 207.190 |
| 3 | 08180046 | 0.500973 | 0.00600100 | 204.416 | 08180045 | 0.00000 | 0.506974 | 197.194 |