| Frame | Nreads | Zeropoints | Mag plots
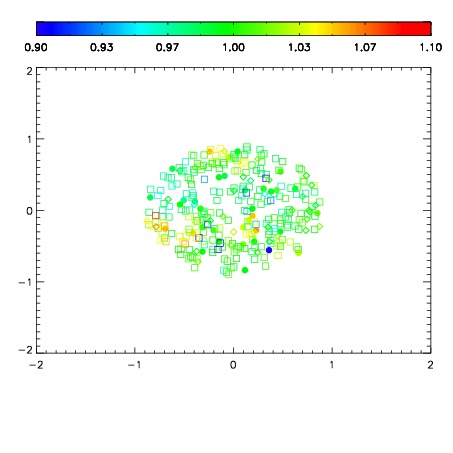
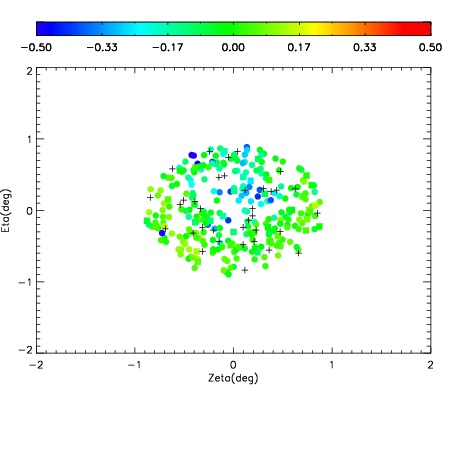
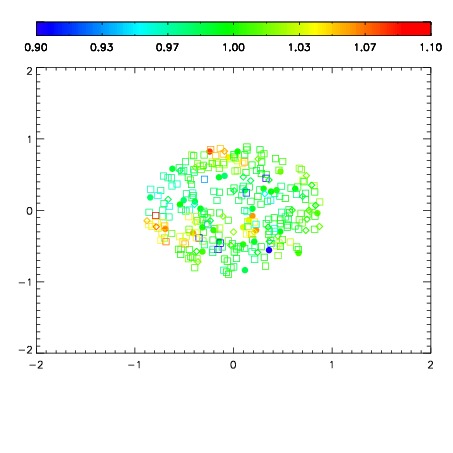
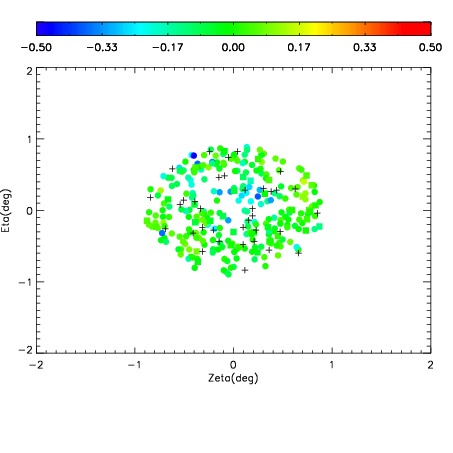
| Spatial mag deviation
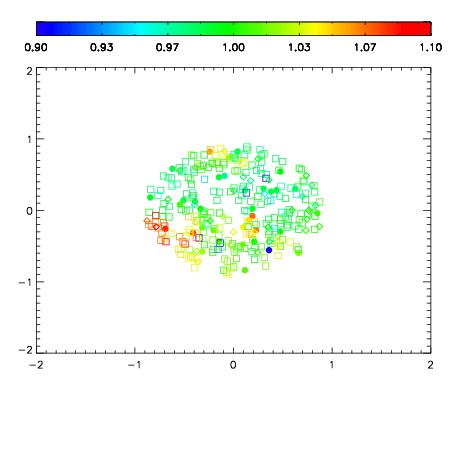
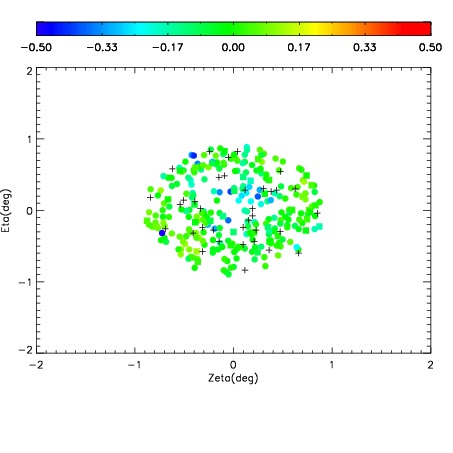
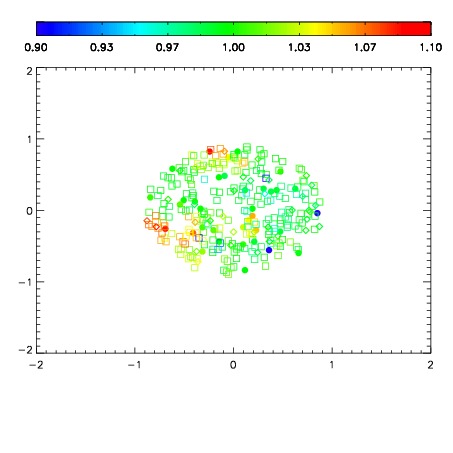
| Spatial sky 16325A emission deviations (filled: sky, open: star)
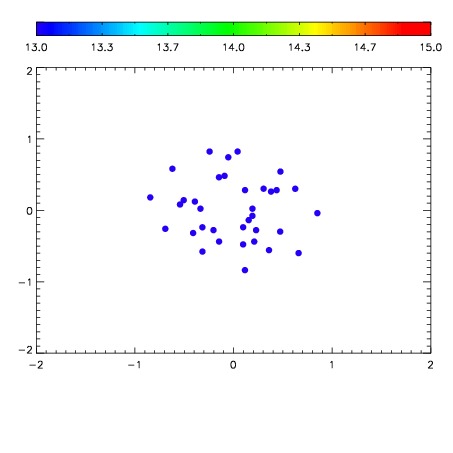
| Spatial sky continuum emission
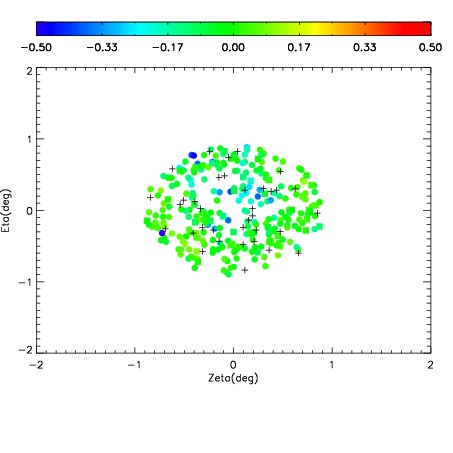
| Spatial sky telluric CO2 absorption deviations (filled: H < 10)
|
| 8190058
| 47
| | Red | Green | Blue
| | z | | 17.98
| | znorm | | 13.80
| | sky | 12.7 | 12.6 | 12.7
| | S/N | 8.5 | 12.7 | 14.4
| | S/N(c) | 7.3 | 11.5 | 13.1
| | SN(E/C) 0.80
|
| 
| 
| 
| 
| 
|
| 8190059
| 47
| | Red | Green | Blue
| | z | | 17.82
| | znorm | | 13.64
| | sky | 12.6 | 12.5 | 12.6
| | S/N | 7.4 | 11.1 | 12.8
| | S/N(c) | 6.5 | 10.3 | 11.9
| | SN(E/C) 0.82
|
| 
| 
| 
| 
| 
|
| 8190060
| 47
| | Red | Green | Blue
| | z | | 17.77
| | znorm | | 13.59
| | sky | 12.6 | 12.5 | 12.5
| | S/N | 7.0 | 10.8 | 12.3
| | S/N(c) | 6.2 | 9.9 | 11.2
| | SN(E/C) 0.85
|
| 
| 
| 
| 
| 
|
| 8190061
| 47
| | Red | Green | Blue
| | z | | 17.79
| | znorm | | 13.61
| | sky | 12.5 | 12.5 | 12.5
| | S/N | 7.0 | 10.9 | 12.3
| | S/N(c) | 6.1 | 9.9 | 11.3
| | SN(E/C) 0.88
|
| 
| 
| 
| 
| 
|
| 8190062
| 47
| | Red | Green | Blue
| | z | | 17.86
| | znorm | | 13.68
| | sky | 12.6 | 12.5 | 12.6
| | S/N | 7.6 | 11.6 | 13.0
| | S/N(c) | 6.6 | 10.6 | 11.9
| | SN(E/C) 0.86
|
| 
| 
| 
| 
| 
|
| 8190063
| 47
| | Red | Green | Blue
| | z | | 17.84
| | znorm | | 13.66
| | sky | 12.5 | 12.4 | 12.4
| | S/N | 7.3 | 11.2 | 12.3
| | S/N(c) | 6.3 | 10.2 | 11.4
| | SN(E/C) 0.87
|
| 
| 
| 
| 
| 
|
| 8190064
| 47
| | Red | Green | Blue
| | z | | 17.04
| | znorm | | 12.86
| | sky | 12.2 | 12.1 | 12.1
| | S/N | 3.8 | 5.9 | 6.5
| | S/N(c) | 3.2 | 5.1 | 5.8
| | SN(E/C) 0.93
|
| 
| 
| 
| 
| 
|
| 8190065
| 47
| | Red | Green | Blue
| | z | | 17.58
| | znorm | | 13.40
| | sky | 12.4 | 12.3 | 12.4
| | S/N | 6.0 | 9.3 | 10.2
| | S/N(c) | 5.2 | 8.4 | 9.3
| | SN(E/C) 0.86
|
| 
| 
| 
| 
| 
|