| Red | Green | Blue | |
| z | 17.64 | ||
| znorm | Inf | ||
| sky | -Inf | -Inf | -Inf |
| S/N | 12.0 | 19.1 | 21.8 |
| S/N(c) | 0.0 | 0.0 | 0.0 |
| SN(E/C) |
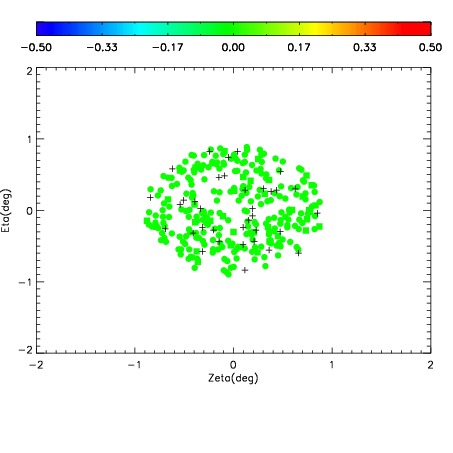
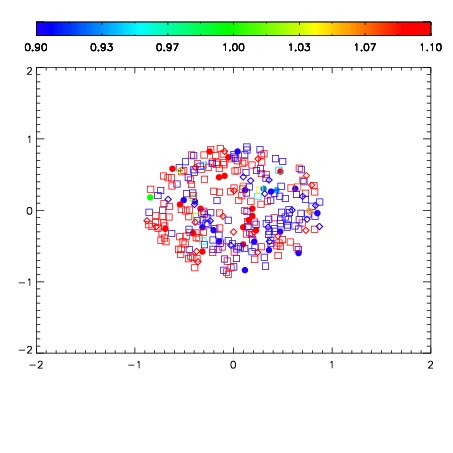
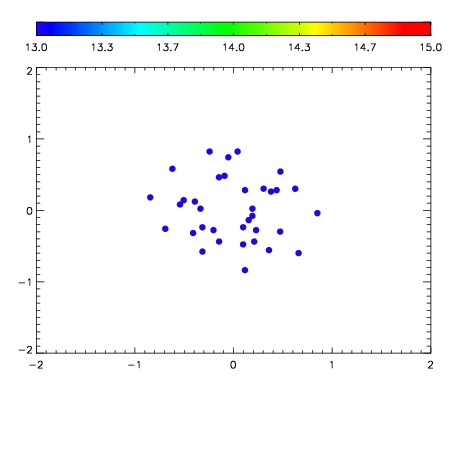

| Frame | Nreads | Zeropoints | Mag plots | Spatial mag deviation | Spatial sky 16325A emission deviations (filled: sky, open: star) | Spatial sky continuum emission | Spatial sky telluric CO2 absorption deviations (filled: H < 10) | |||||||||||||||||||||||
| 0 | 0 |
|
|
|
|
|
|
| IPAIR | NAME | SHIFT | NEWSHIFT | S/N | NAME | SHIFT | NEWSHIFT | S/N |
| 0 | 08190060 | 0.507870 | 0.00000 | 123.508 | 08190061 | -0.00330939 | 0.511179 | 125.358 |
| 1 | 08190063 | 0.504979 | 0.00289100 | 127.375 | 08190058 | 0.00000 | 0.507870 | 137.324 |
| 2 | 08190059 | 0.505764 | 0.00210601 | 126.707 | 08190062 | -0.00407277 | 0.511943 | 129.152 |
| 3 | 08190064 | 0.507237 | 0.000633001 | 85.4222 | 08190065 | -0.00422664 | 0.512097 | 112.550 |