| Red | Green | Blue | |
| z | 17.64 | ||
| znorm | Inf | ||
| sky | -Inf | -Inf | -Inf |
| S/N | 19.8 | 31.1 | 33.0 |
| S/N(c) | 0.0 | 0.0 | 0.0 |
| SN(E/C) |
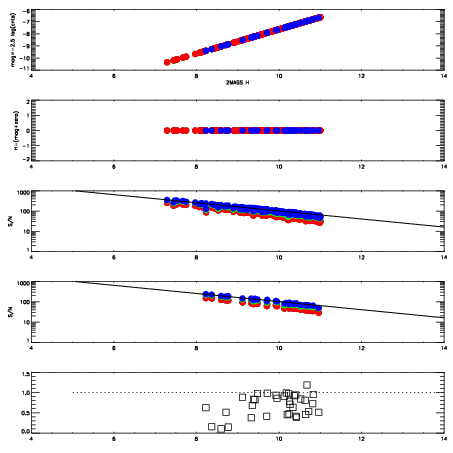
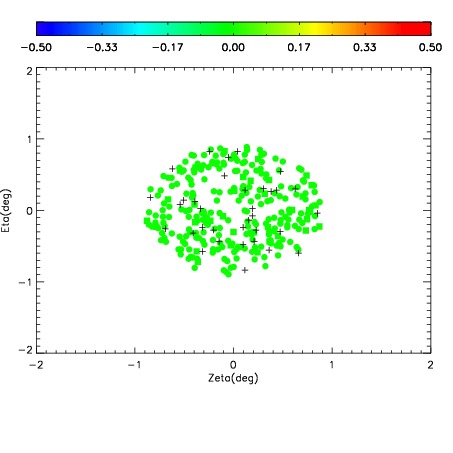
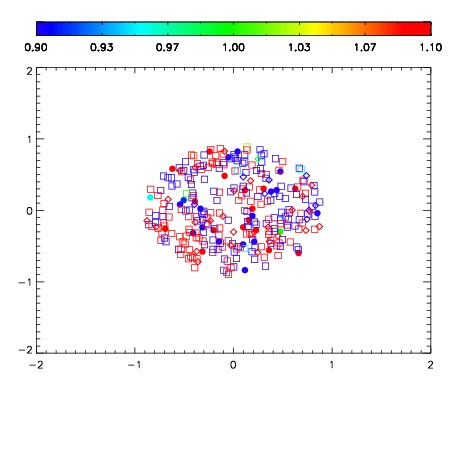
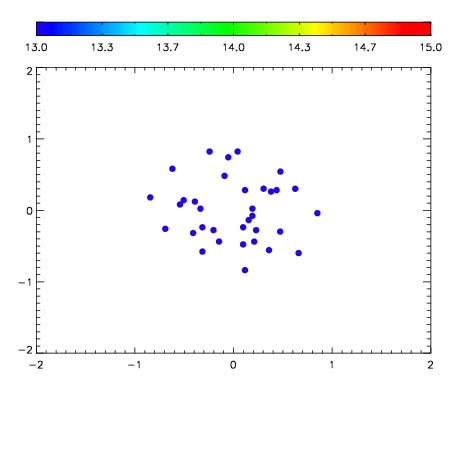

| Frame | Nreads | Zeropoints | Mag plots | Spatial mag deviation | Spatial sky 16325A emission deviations (filled: sky, open: star) | Spatial sky continuum emission | Spatial sky telluric CO2 absorption deviations (filled: H < 10) | |||||||||||||||||||||||
| 0 | 0 |
|
|
|
|
|
|
| IPAIR | NAME | SHIFT | NEWSHIFT | S/N | NAME | SHIFT | NEWSHIFT | S/N |
| 0 | 08690028 | 0.482404 | 0.00000 | 156.705 | 08690026 | 0.00000 | 0.482404 | 165.882 |
| 1 | 08690031 | 0.481127 | 0.00127700 | 181.958 | 08690030 | 0.00330942 | 0.479095 | 181.789 |
| 2 | 08690027 | 0.481750 | 0.000653982 | 166.195 | 08690029 | 0.00218136 | 0.480223 | 168.245 |