| Red | Green | Blue | |
| z | 17.64 | ||
| znorm | Inf | ||
| sky | -Inf | -Inf | -Inf |
| S/N | 15.0 | 25.3 | 27.3 |
| S/N(c) | 0.0 | 0.0 | 0.0 |
| SN(E/C) |

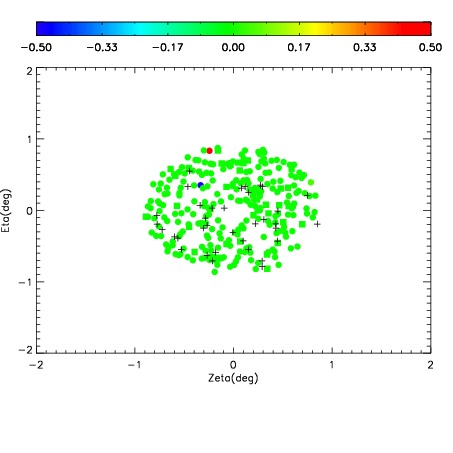
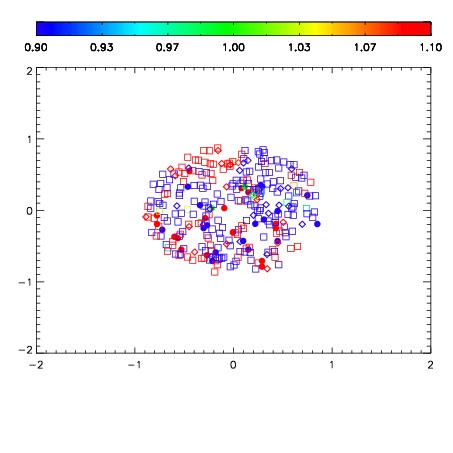


| Frame | Nreads | Zeropoints | Mag plots | Spatial mag deviation | Spatial sky 16325A emission deviations (filled: sky, open: star) | Spatial sky continuum emission | Spatial sky telluric CO2 absorption deviations (filled: H < 10) | |||||||||||||||||||||||
| 0 | 0 |
|
|
|
|
|
|
| IPAIR | NAME | SHIFT | NEWSHIFT | S/N | NAME | SHIFT | NEWSHIFT | S/N |
| 0 | 08430087 | 0.485490 | 0.00000 | 91.4369 | 08430085 | -0.000253631 | 0.485744 | 136.460 |
| 1 | 08430082 | 0.484356 | 0.00113401 | 179.170 | 08430081 | 0.00000 | 0.485490 | 182.028 |
| 2 | 08430083 | 0.484854 | 0.000635982 | 83.1927 | 08430084 | -0.000589827 | 0.486080 | 115.869 |
| 3 | 08430086 | 0.485243 | 0.000247002 | 83.1010 | 08430088 | 0.000966923 | 0.484523 | 112.890 |