| Red | Green | Blue | |
| z | 17.64 | ||
| znorm | Inf | ||
| sky | -Inf | -Inf | -Inf |
| S/N | 21.3 | 34.1 | 36.3 |
| S/N(c) | 0.0 | 0.0 | 0.0 |
| SN(E/C) |

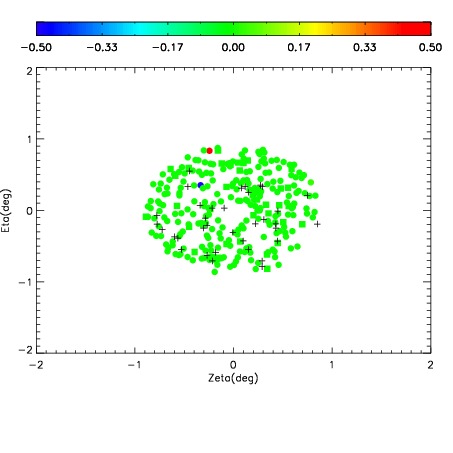
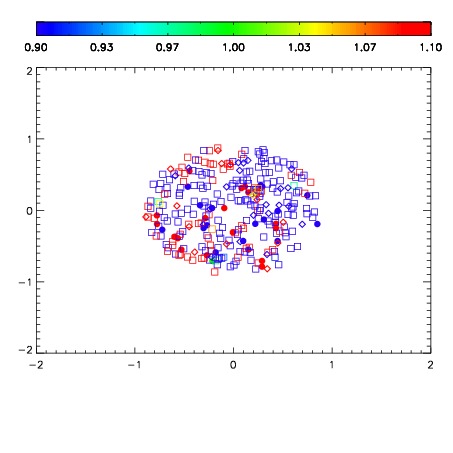


| Frame | Nreads | Zeropoints | Mag plots | Spatial mag deviation | Spatial sky 16325A emission deviations (filled: sky, open: star) | Spatial sky continuum emission | Spatial sky telluric CO2 absorption deviations (filled: H < 10) | |||||||||||||||||||||||
| 0 | 0 |
|
|
|
|
|
|
| IPAIR | NAME | SHIFT | NEWSHIFT | S/N | NAME | SHIFT | NEWSHIFT | S/N |
| 0 | 08440071 | 0.487107 | 0.00000 | 194.203 | 08440072 | 0.00416806 | 0.482939 | 194.606 |
| 1 | 08440074 | 0.483363 | 0.00374401 | 199.905 | 08440073 | 0.00147542 | 0.485632 | 196.807 |
| 2 | 08440070 | 0.486876 | 0.000230998 | 193.659 | 08440069 | 0.00000 | 0.487107 | 192.963 |