| Red | Green | Blue | |
| z | 17.64 | ||
| znorm | Inf | ||
| sky | -Inf | -Inf | -Inf |
| S/N | 29.9 | 44.3 | 47.1 |
| S/N(c) | 0.0 | 0.0 | 0.0 |
| SN(E/C) |
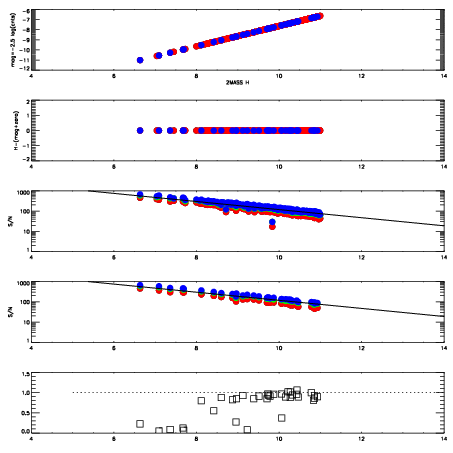
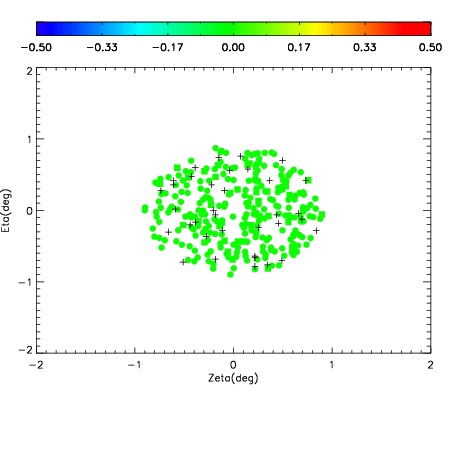
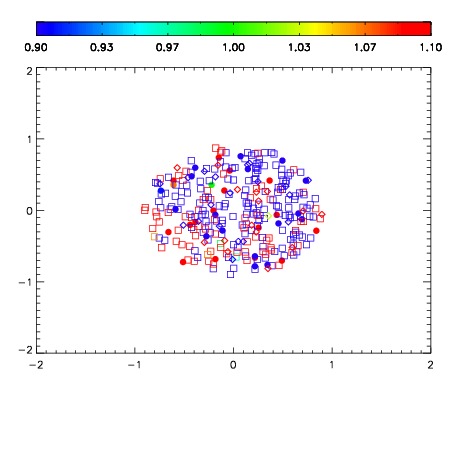
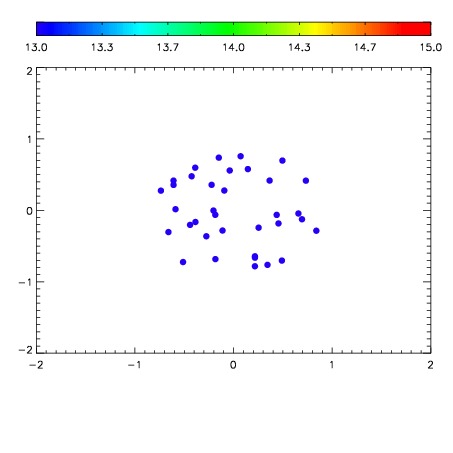

| Frame | Nreads | Zeropoints | Mag plots | Spatial mag deviation | Spatial sky 16325A emission deviations (filled: sky, open: star) | Spatial sky continuum emission | Spatial sky telluric CO2 absorption deviations (filled: H < 10) | |||||||||||||||||||||||
| 0 | 0 |
|
|
|
|
|
|
| IPAIR | NAME | SHIFT | NEWSHIFT | S/N | NAME | SHIFT | NEWSHIFT | S/N |
| 0 | 08500057 | 0.487480 | 0.00000 | 208.019 | 08500055 | 0.00000 | 0.487480 | 205.376 |
| 1 | 08500060 | 0.486234 | 0.00124601 | 216.575 | 08500058 | 0.00405220 | 0.483428 | 214.160 |
| 2 | 08500061 | 0.487473 | 7.00355e-06 | 212.366 | 08500059 | 0.00315920 | 0.484321 | 210.267 |
| 3 | 08500056 | 0.484742 | 0.00273803 | 208.156 | 08500062 | 0.00209404 | 0.485386 | 207.690 |