| Red | Green | Blue | |
| z | 17.64 | ||
| znorm | Inf | ||
| sky | -NaN | -Inf | -Inf |
| S/N | 27.8 | 42.8 | 46.5 |
| S/N(c) | 0.0 | 0.0 | 0.0 |
| SN(E/C) |
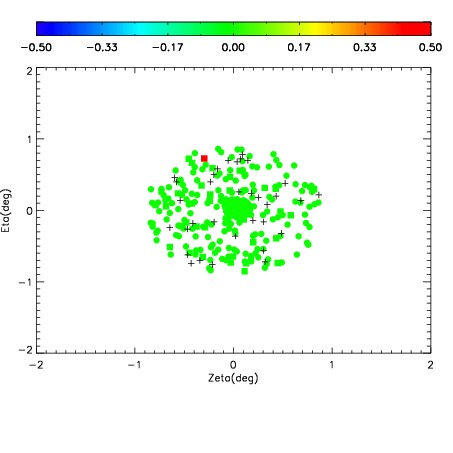
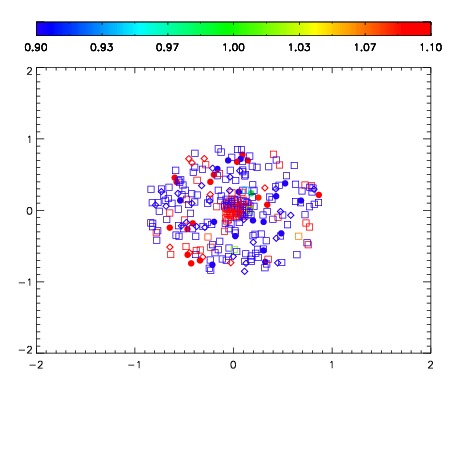
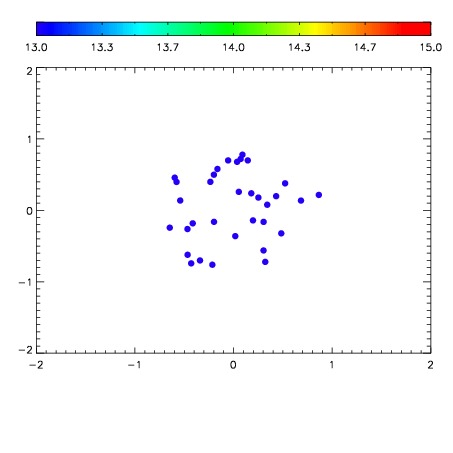

| Frame | Nreads | Zeropoints | Mag plots | Spatial mag deviation | Spatial sky 16325A emission deviations (filled: sky, open: star) | Spatial sky continuum emission | Spatial sky telluric CO2 absorption deviations (filled: H < 10) | |||||||||||||||||||||||
| 0 | 0 |
|
|
|
|
|
|
| IPAIR | NAME | SHIFT | NEWSHIFT | S/N | NAME | SHIFT | NEWSHIFT | S/N |
| 0 | 12470027 | 0.491999 | 0.00000 | 204.711 | 12470026 | 0.000379699 | 0.491619 | 215.906 |
| 1 | 12470023 | 0.490036 | 0.00196299 | 225.827 | 12470029 | 0.000568207 | 0.491431 | 232.916 |
| 2 | 12470024 | 0.490244 | 0.00175500 | 221.951 | 12470022 | 0.00000 | 0.491999 | 225.023 |
| 3 | 12470028 | 0.491364 | 0.000634998 | 220.810 | 12470025 | 0.00117114 | 0.490828 | 218.112 |