| Red | Green | Blue | |
| z | 17.64 | ||
| znorm | Inf | ||
| sky | -NaN | -Inf | -Inf |
| S/N | 14.5 | 23.7 | 25.7 |
| S/N(c) | 0.0 | 0.0 | 0.0 |
| SN(E/C) |
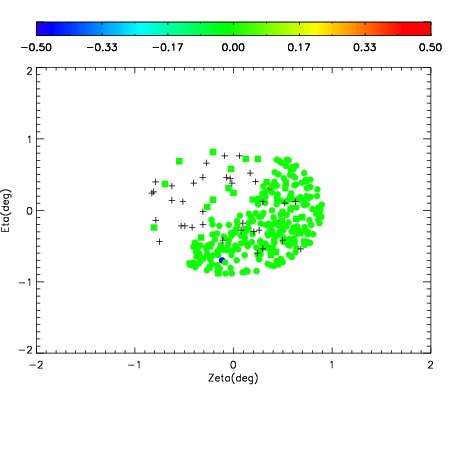
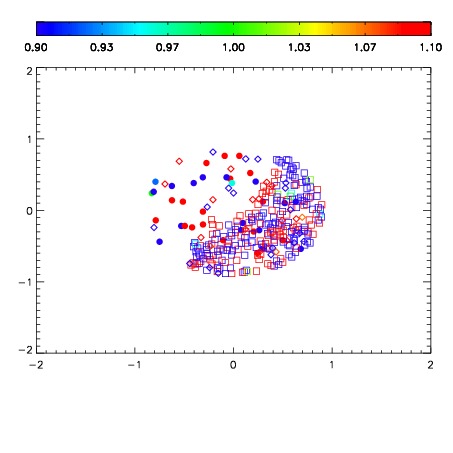
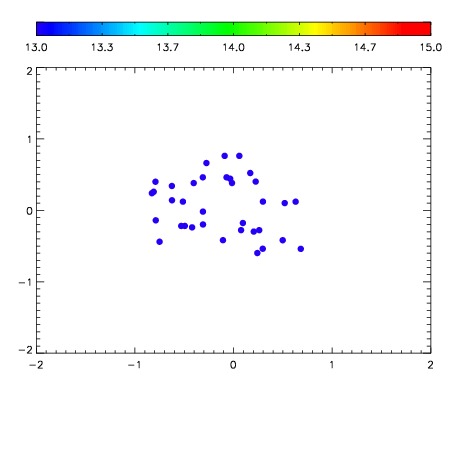

| Frame | Nreads | Zeropoints | Mag plots | Spatial mag deviation | Spatial sky 16325A emission deviations (filled: sky, open: star) | Spatial sky continuum emission | Spatial sky telluric CO2 absorption deviations (filled: H < 10) | |||||||||||||||||||||||
| 0 | 0 |
|
|
|
|
|
|
| IPAIR | NAME | SHIFT | NEWSHIFT | S/N | NAME | SHIFT | NEWSHIFT | S/N |
| 0 | 12490026 | 0.497537 | 0.00000 | 126.600 | 12490024 | 0.000386124 | 0.497151 | 128.590 |
| 1 | 12490022 | 0.493339 | 0.00419798 | 133.009 | 12490027 | 0.00261123 | 0.494926 | 159.760 |
| 2 | 12490025 | 0.494530 | 0.00300699 | 114.359 | 12490023 | -0.00194473 | 0.499482 | 126.322 |
| 3 | 12490021 | 0.493854 | 0.00368300 | 102.202 | 12490020 | 0.00000 | 0.497537 | 88.4546 |