| Red | Green | Blue | |
| z | 17.64 | ||
| znorm | Inf | ||
| sky | -Inf | -Inf | -Inf |
| S/N | 29.2 | 42.6 | 46.1 |
| S/N(c) | 0.0 | 0.0 | 0.0 |
| SN(E/C) |
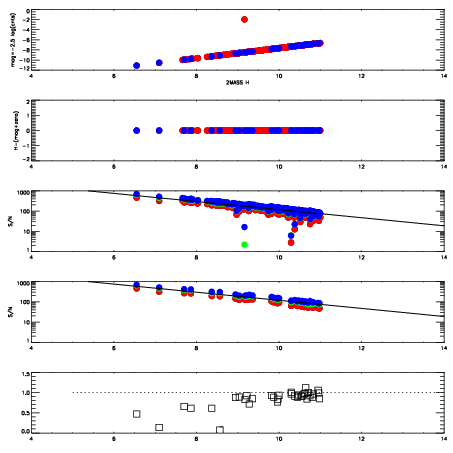
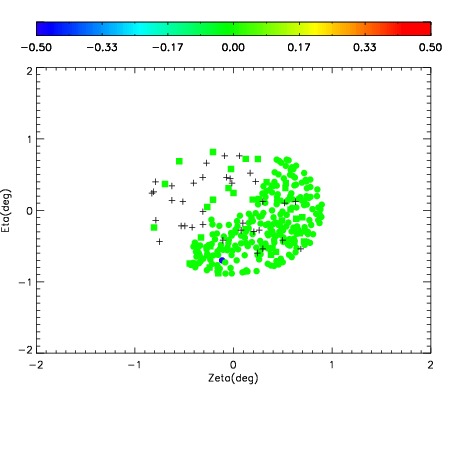
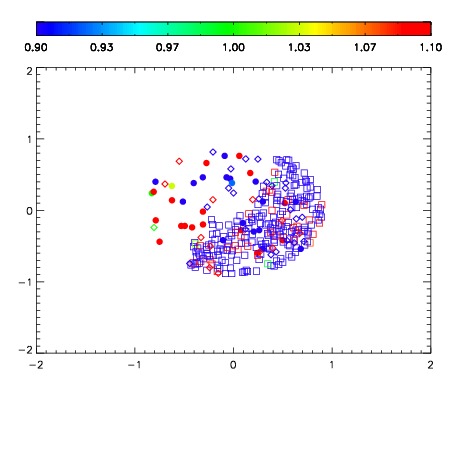
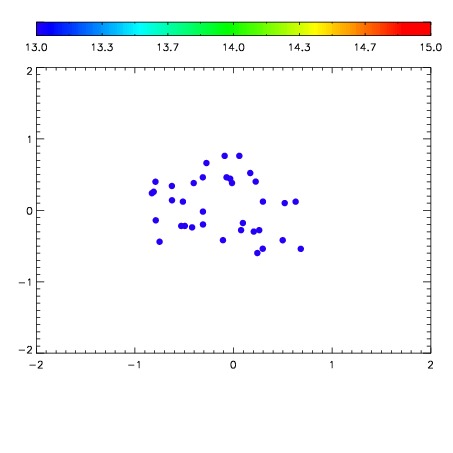

| Frame | Nreads | Zeropoints | Mag plots | Spatial mag deviation | Spatial sky 16325A emission deviations (filled: sky, open: star) | Spatial sky continuum emission | Spatial sky telluric CO2 absorption deviations (filled: H < 10) | |||||||||||||||||||||||
| 0 | 0 |
|
|
|
|
|
|
| IPAIR | NAME | SHIFT | NEWSHIFT | S/N | NAME | SHIFT | NEWSHIFT | S/N |
| 0 | 12530050 | 0.487931 | 0.00000 | 217.695 | 12530055 | 0.00274811 | 0.485183 | 222.278 |
| 1 | 12530049 | 0.486589 | 0.00134200 | 224.318 | 12530048 | 0.00000 | 0.487931 | 224.611 |
| 2 | 12530053 | 0.486781 | 0.00115001 | 212.906 | 12530052 | 0.00269261 | 0.485238 | 215.477 |
| 3 | 12530054 | 0.486598 | 0.00133300 | 212.419 | 12530051 | 0.00258703 | 0.485344 | 186.349 |