| Red | Green | Blue | |
| z | 17.64 | ||
| znorm | Inf | ||
| sky | -Inf | -Inf | -Inf |
| S/N | 23.1 | 33.9 | 37.3 |
| S/N(c) | 0.0 | 0.0 | 0.0 |
| SN(E/C) |
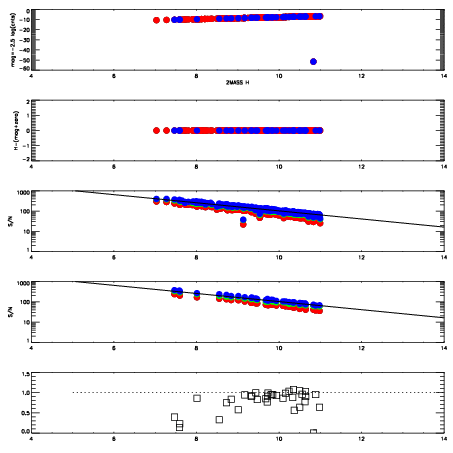
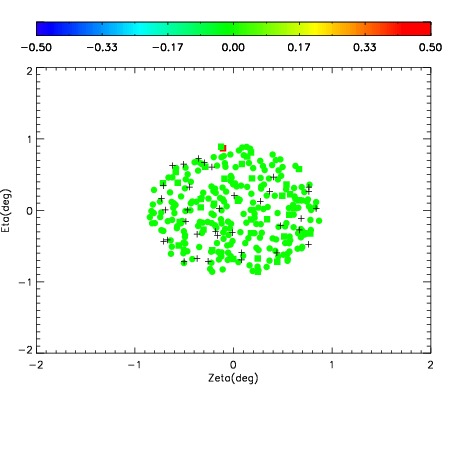
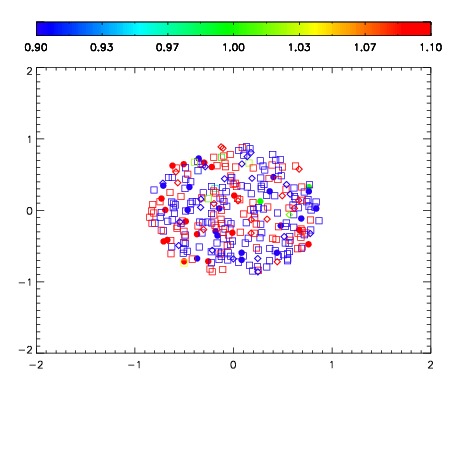
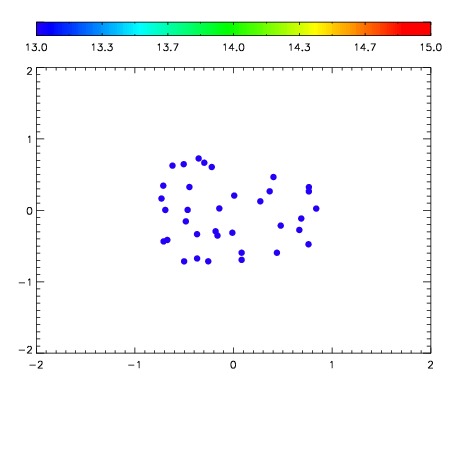

| Frame | Nreads | Zeropoints | Mag plots | Spatial mag deviation | Spatial sky 16325A emission deviations (filled: sky, open: star) | Spatial sky continuum emission | Spatial sky telluric CO2 absorption deviations (filled: H < 10) | |||||||||||||||||||||||
| 0 | 0 |
|
|
|
|
|
|
| IPAIR | NAME | SHIFT | NEWSHIFT | S/N | NAME | SHIFT | NEWSHIFT | S/N |
| 0 | 08190071 | 0.511344 | 0.00000 | 170.708 | 08190072 | -0.00175856 | 0.513103 | 191.400 |
| 1 | 08190074 | 0.502547 | 0.00879699 | 201.571 | 08190073 | -0.00180216 | 0.513146 | 195.225 |
| 2 | 08190070 | 0.508024 | 0.00332004 | 168.267 | 08190069 | 0.00000 | 0.511344 | 173.566 |