| Red | Green | Blue | |
| z | 17.64 | ||
| znorm | Inf | ||
| sky | -Inf | -Inf | -Inf |
| S/N | 30.8 | 45.9 | 48.9 |
| S/N(c) | 0.0 | 0.0 | 0.0 |
| SN(E/C) |
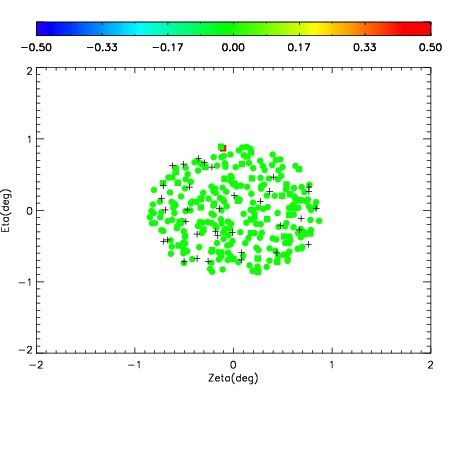
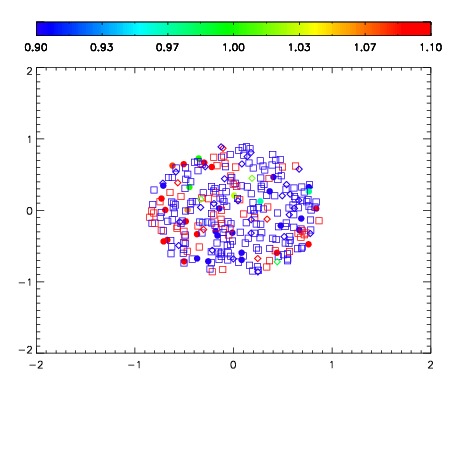
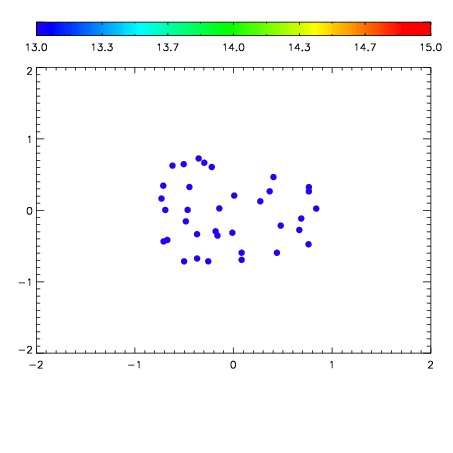

| Frame | Nreads | Zeropoints | Mag plots | Spatial mag deviation | Spatial sky 16325A emission deviations (filled: sky, open: star) | Spatial sky continuum emission | Spatial sky telluric CO2 absorption deviations (filled: H < 10) | |||||||||||||||||||||||
| 0 | 0 |
|
|
|
|
|
|
| IPAIR | NAME | SHIFT | NEWSHIFT | S/N | NAME | SHIFT | NEWSHIFT | S/N |
| 0 | 08410072 | 0.502779 | 0.00000 | 166.903 | 08410070 | 0.00000 | 0.502779 | 161.253 |
| 1 | 08410076 | 0.500468 | 0.00231099 | 174.716 | 08410077 | 0.00527326 | 0.497506 | 176.321 |
| 2 | 08410071 | 0.502210 | 0.000568986 | 170.204 | 08410073 | 0.000133977 | 0.502645 | 172.348 |
| 3 | 08410075 | 0.500108 | 0.00267100 | 169.841 | 08410074 | -0.000304006 | 0.503083 | 164.115 |