| Red | Green | Blue | |
| z | 17.64 | ||
| znorm | Inf | ||
| sky | -NaN | -NaN | -Inf |
| S/N | 15.3 | 25.2 | 26.8 |
| S/N(c) | 0.0 | 0.0 | 0.0 |
| SN(E/C) |
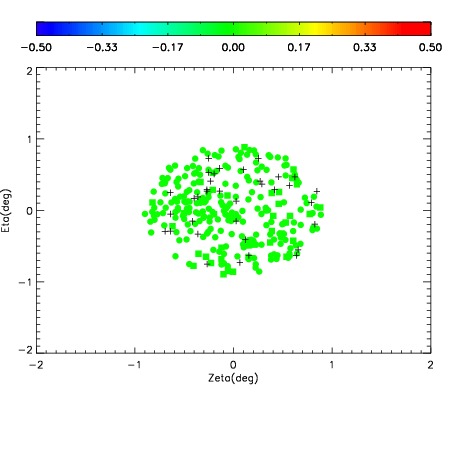
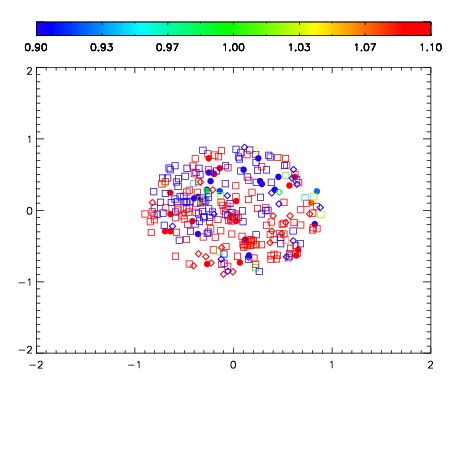
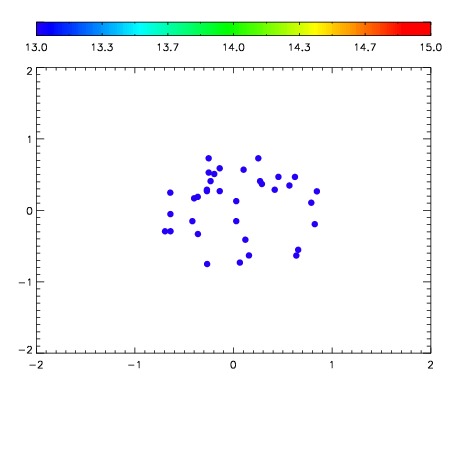

| Frame | Nreads | Zeropoints | Mag plots | Spatial mag deviation | Spatial sky 16325A emission deviations (filled: sky, open: star) | Spatial sky continuum emission | Spatial sky telluric CO2 absorption deviations (filled: H < 10) | |||||||||||||||||||||||
| 0 | 0 |
|
|
|
|
|
|
| IPAIR | NAME | SHIFT | NEWSHIFT | S/N | NAME | SHIFT | NEWSHIFT | S/N |
| 0 | 08830016 | 0.486140 | 0.00000 | 152.464 | 08830014 | 0.00269454 | 0.483445 | 166.367 |
| 1 | 08830015 | 0.484595 | 0.00154501 | 170.179 | 08830017 | 0.00510606 | 0.481034 | 179.135 |
| 2 | 08830012 | 0.483020 | 0.00312001 | 144.479 | 08830013 | 0.00261622 | 0.483524 | 152.354 |
| 3 | 08830011 | 0.482822 | 0.00331801 | 131.650 | 08830010 | 0.00000 | 0.486140 | 115.370 |