| Red | Green | Blue | |
| z | 17.64 | ||
| znorm | Inf | ||
| sky | -NaN | -NaN | -Inf |
| S/N | 27.5 | 46.7 | 50.5 |
| S/N(c) | 0.0 | 0.0 | 0.0 |
| SN(E/C) |
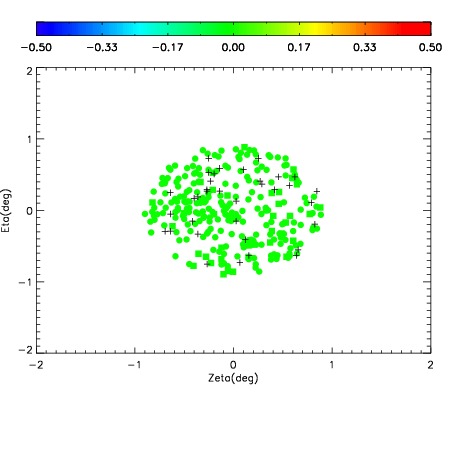

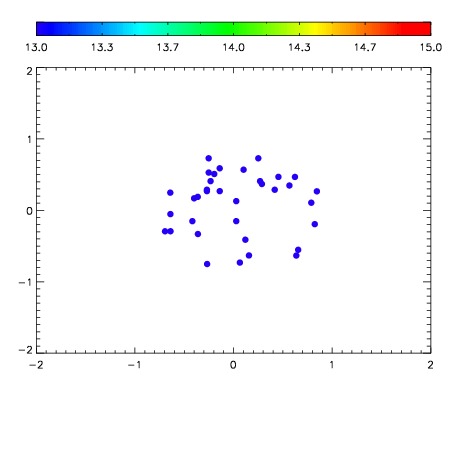

| Frame | Nreads | Zeropoints | Mag plots | Spatial mag deviation | Spatial sky 16325A emission deviations (filled: sky, open: star) | Spatial sky continuum emission | Spatial sky telluric CO2 absorption deviations (filled: H < 10) | |||||||||||||||||||||||
| 0 | 0 |
|
|
|
|
|
|
| IPAIR | NAME | SHIFT | NEWSHIFT | S/N | NAME | SHIFT | NEWSHIFT | S/N |
| 0 | 09070041 | 0.480456 | 0.00000 | 231.452 | 09070036 | 0.00000 | 0.480456 | 232.994 |
| 1 | 09070042 | 0.479608 | 0.000847995 | 239.403 | 09070043 | 0.00904236 | 0.471414 | 241.383 |
| 2 | 09070037 | 0.477235 | 0.00322101 | 235.839 | 09070040 | 0.00185818 | 0.478598 | 239.033 |
| 3 | 09070038 | 0.478142 | 0.00231400 | 230.703 | 09070039 | 0.00175254 | 0.478703 | 232.966 |