| Red | Green | Blue | |
| z | 17.64 | ||
| znorm | Inf | ||
| sky | -Inf | -Inf | -Inf |
| S/N | 29.3 | 50.2 | 53.2 |
| S/N(c) | 0.0 | 0.0 | 0.0 |
| SN(E/C) |

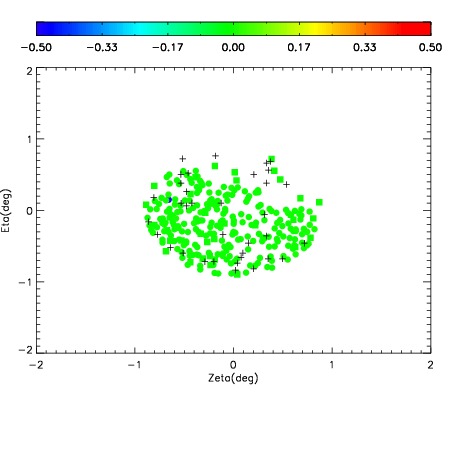

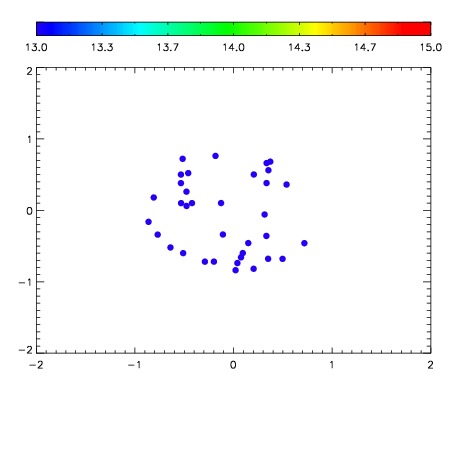

| Frame | Nreads | Zeropoints | Mag plots | Spatial mag deviation | Spatial sky 16325A emission deviations (filled: sky, open: star) | Spatial sky continuum emission | Spatial sky telluric CO2 absorption deviations (filled: H < 10) | |||||||||||||||||||||||
| 0 | 0 |
|
|
|
|
|
|
| IPAIR | NAME | SHIFT | NEWSHIFT | S/N | NAME | SHIFT | NEWSHIFT | S/N |
| 0 | 12480028 | 0.496520 | 0.00000 | 210.143 | 12480025 | -0.00159883 | 0.498119 | 211.559 |
| 1 | 12480023 | 0.493809 | 0.00271100 | 210.606 | 12480022 | 0.00000 | 0.496520 | 211.943 |
| 2 | 12480024 | 0.493768 | 0.00275201 | 207.171 | 12480026 | -0.00115457 | 0.497675 | 206.119 |
| 3 | 12480027 | 0.496381 | 0.000138998 | 197.658 | 12480029 | -0.000516614 | 0.497037 | 196.969 |