| Red | Green | Blue | |
| z | 17.64 | ||
| znorm | Inf | ||
| sky | -Inf | -Inf | -Inf |
| S/N | 32.8 | 48.5 | 52.3 |
| S/N(c) | 0.0 | 0.0 | 0.0 |
| SN(E/C) |
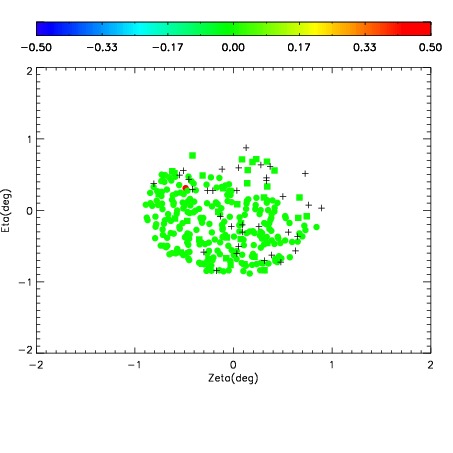
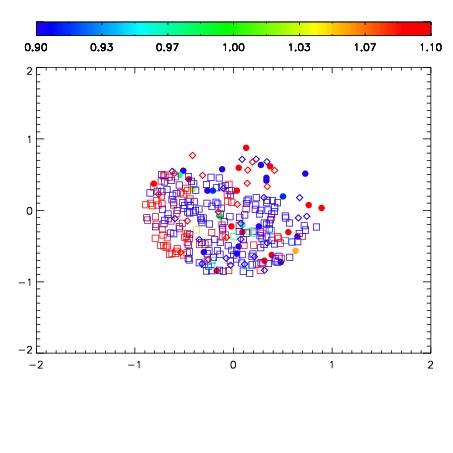
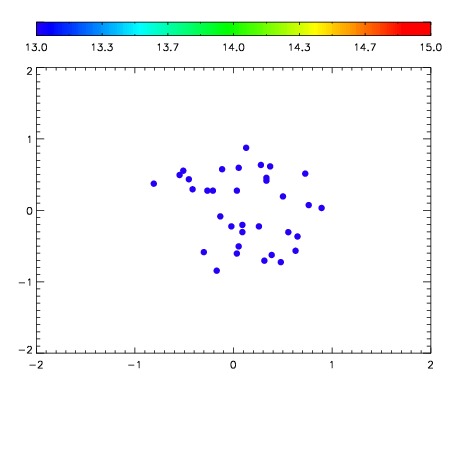

| Frame | Nreads | Zeropoints | Mag plots | Spatial mag deviation | Spatial sky 16325A emission deviations (filled: sky, open: star) | Spatial sky continuum emission | Spatial sky telluric CO2 absorption deviations (filled: H < 10) | |||||||||||||||||||||||
| 0 | 0 |
|
|
|
|
|
|
| IPAIR | NAME | SHIFT | NEWSHIFT | S/N | NAME | SHIFT | NEWSHIFT | S/N |
| 0 | 12530064 | 0.481254 | 0.00000 | 185.027 | 12530066 | -0.00298413 | 0.484238 | 186.316 |
| 1 | 12530060 | 0.479095 | 0.00215900 | 208.894 | 12530059 | 0.00000 | 0.481254 | 206.164 |
| 2 | 12530061 | 0.480608 | 0.000646025 | 207.049 | 12530063 | -0.00228016 | 0.483534 | 201.615 |
| 3 | 12530065 | 0.481228 | 2.60174e-05 | 191.014 | 12530062 | -0.00118468 | 0.482439 | 197.804 |