| Red | Green | Blue | |
| z | 17.64 | ||
| znorm | Inf | ||
| sky | -Inf | -NaN | -Inf |
| S/N | 30.6 | 49.0 | 51.3 |
| S/N(c) | 0.0 | 0.0 | 0.0 |
| SN(E/C) |
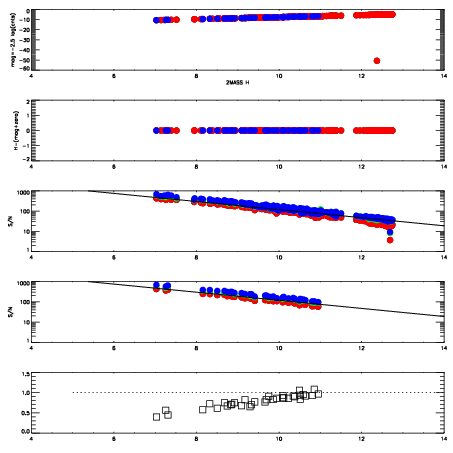
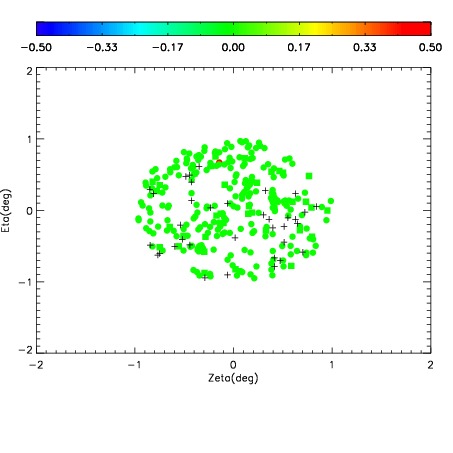
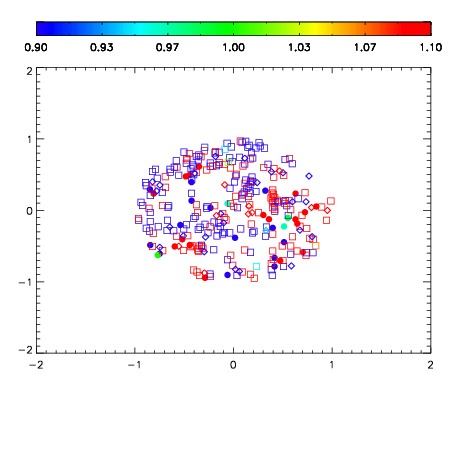


| Frame | Nreads | Zeropoints | Mag plots | Spatial mag deviation | Spatial sky 16325A emission deviations (filled: sky, open: star) | Spatial sky continuum emission | Spatial sky telluric CO2 absorption deviations (filled: H < 10) | |||||||||||||||||||||||
| 0 | 0 |
|
|
|
|
|
|
| IPAIR | NAME | SHIFT | NEWSHIFT | S/N | NAME | SHIFT | NEWSHIFT | S/N |
| 0 | 09730012 | 0.510088 | 0.00000 | 207.668 | 09730015 | 0.000629619 | 0.509458 | 213.498 |
| 1 | 09730017 | 0.509609 | 0.000479043 | 217.017 | 09730014 | 0.000538000 | 0.509550 | 217.738 |
| 2 | 09730016 | 0.509351 | 0.000737011 | 211.150 | 09730018 | 0.00281586 | 0.507272 | 216.928 |
| 3 | 09730013 | 0.509884 | 0.000204027 | 208.151 | 09730011 | 0.00000 | 0.510088 | 213.780 |