| Red | Green | Blue | |
| z | 17.64 | ||
| znorm | Inf | ||
| sky | -Inf | -Inf | -Inf |
| S/N | 12.8 | 19.2 | 16.5 |
| S/N(c) | 0.0 | 0.0 | 0.0 |
| SN(E/C) |
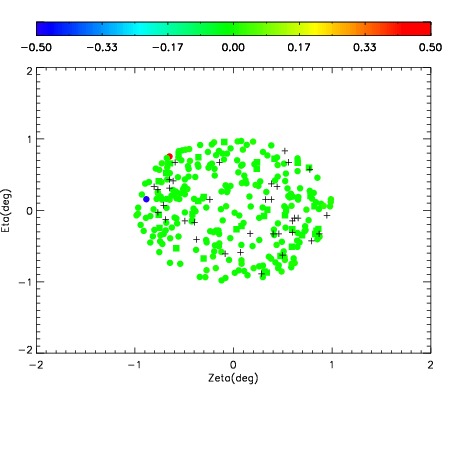
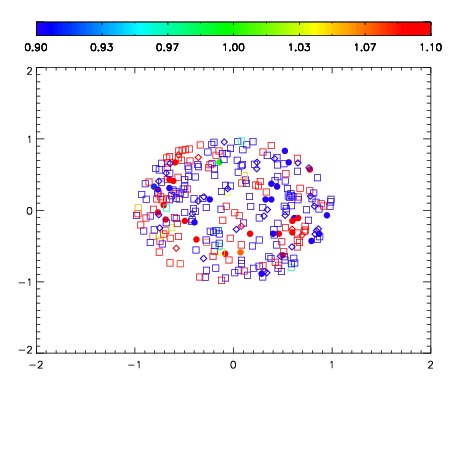
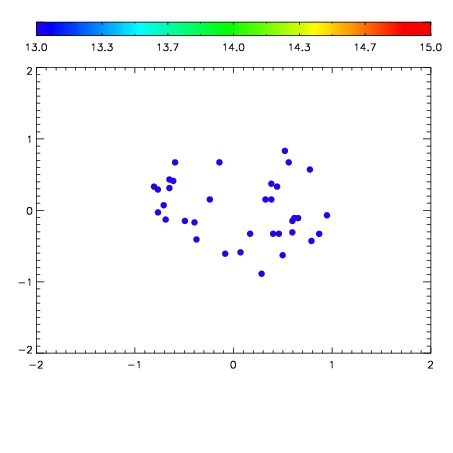

| Frame | Nreads | Zeropoints | Mag plots | Spatial mag deviation | Spatial sky 16325A emission deviations (filled: sky, open: star) | Spatial sky continuum emission | Spatial sky telluric CO2 absorption deviations (filled: H < 10) | |||||||||||||||||||||||
| 0 | 0 |
|
|
|
|
|
|
| IPAIR | NAME | SHIFT | NEWSHIFT | S/N | NAME | SHIFT | NEWSHIFT | S/N |
| 0 | 08730061 | 0.483067 | 0.00000 | 104.944 | 08730062 | 0.00346285 | 0.479604 | 82.9158 |
| 1 | 08730060 | 0.482026 | 0.00104100 | 130.581 | 08730059 | 0.00000 | 0.483067 | 150.504 |
| 2 | 08730065 | 0.482686 | 0.000380993 | 27.5780 | 08730063 | 0.00353324 | 0.479534 | 46.0856 |
| 3 | 08730064 | 0.482561 | 0.000506014 | 24.9056 | 08730066 | -0.000434711 | 0.483502 | 45.6637 |