| Red | Green | Blue | |
| z | 17.64 | ||
| znorm | Inf | ||
| sky | -NaN | -NaN | -Inf |
| S/N | 22.2 | 31.5 | 26.9 |
| S/N(c) | 0.0 | 0.0 | 0.0 |
| SN(E/C) |
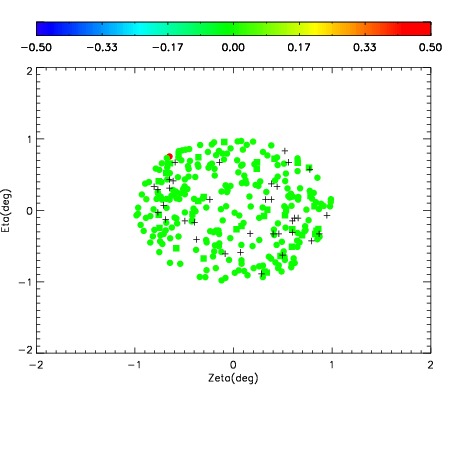
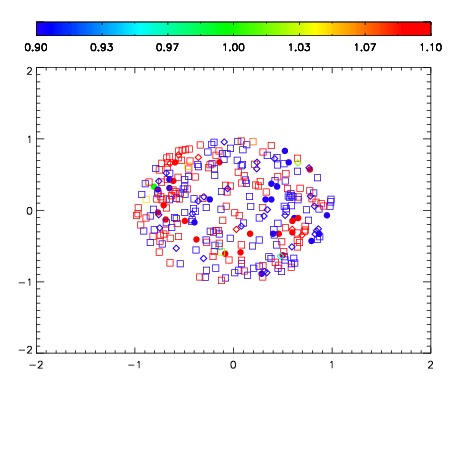
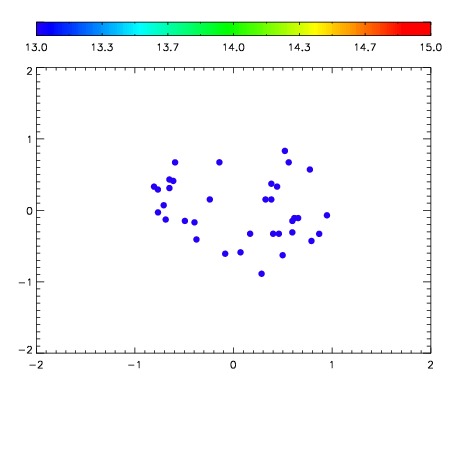

| Frame | Nreads | Zeropoints | Mag plots | Spatial mag deviation | Spatial sky 16325A emission deviations (filled: sky, open: star) | Spatial sky continuum emission | Spatial sky telluric CO2 absorption deviations (filled: H < 10) | |||||||||||||||||||||||
| 0 | 0 |
|
|
|
|
|
|
| IPAIR | NAME | SHIFT | NEWSHIFT | S/N | NAME | SHIFT | NEWSHIFT | S/N |
| 0 | 08750027 | 0.484681 | 0.00000 | 162.229 | 08750026 | 0.00144342 | 0.483238 | 149.508 |
| 1 | 08750028 | 0.484396 | 0.000285000 | 165.153 | 08750029 | 0.000789085 | 0.483892 | 163.691 |
| 2 | 08750024 | 0.483838 | 0.000843018 | 95.7543 | 08750025 | 0.00158384 | 0.483097 | 110.417 |
| 3 | 08750023 | 0.484143 | 0.000538021 | 92.4248 | 08750022 | 0.00000 | 0.484681 | 96.9695 |