| Red | Green | Blue | |
| z | 17.64 | ||
| znorm | Inf | ||
| sky | -NaN | -NaN | -Inf |
| S/N | 41.2 | 60.1 | 64.4 |
| S/N(c) | 0.0 | 0.0 | 0.0 |
| SN(E/C) |
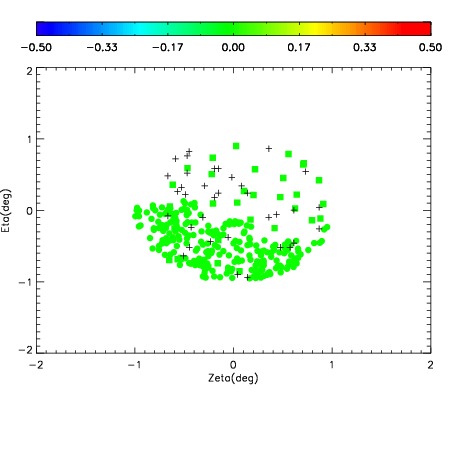
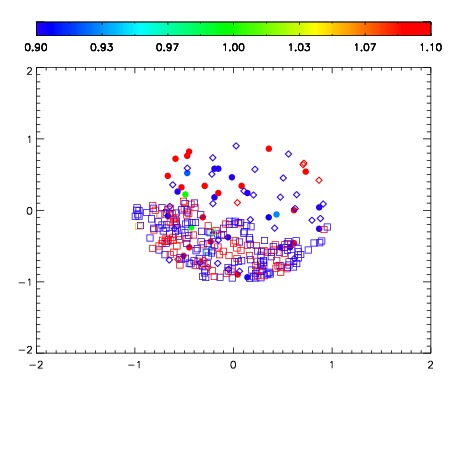
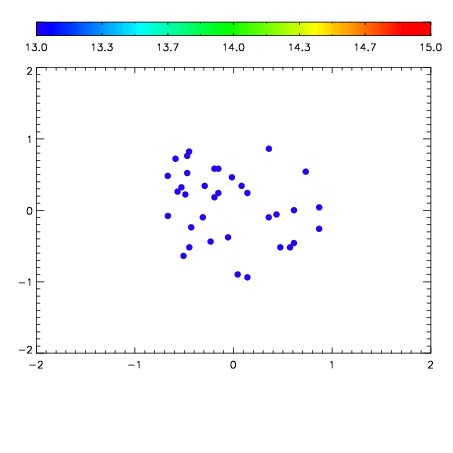

| Frame | Nreads | Zeropoints | Mag plots | Spatial mag deviation | Spatial sky 16325A emission deviations (filled: sky, open: star) | Spatial sky continuum emission | Spatial sky telluric CO2 absorption deviations (filled: H < 10) | |||||||||||||||||||||||
| 0 | 0 |
|
|
|
|
|
|
| IPAIR | NAME | SHIFT | NEWSHIFT | S/N | NAME | SHIFT | NEWSHIFT | S/N |
| 0 | 08420083 | 0.481975 | 0.00000 | 236.760 | 08420084 | 0.00474037 | 0.477235 | 236.169 |
| 1 | 08420087 | 0.479924 | 0.00205100 | 236.263 | 08420085 | -0.00377589 | 0.485751 | 235.243 |
| 2 | 08420086 | 0.478641 | 0.00333399 | 234.805 | 08420089 | -0.00103392 | 0.483009 | 233.390 |
| 3 | 08420082 | 0.480535 | 0.00143999 | 233.677 | 08420081 | 0.00000 | 0.481975 | 233.030 |
| 4 | 08420090 | 0.481413 | 0.000561982 | 233.159 | 08420088 | 0.000716677 | 0.481258 | 227.696 |