| Red | Green | Blue | |
| z | 17.64 | ||
| znorm | Inf | ||
| sky | -Inf | -Inf | -Inf |
| S/N | 16.6 | 26.8 | 29.4 |
| S/N(c) | 0.0 | 0.0 | 0.0 |
| SN(E/C) |
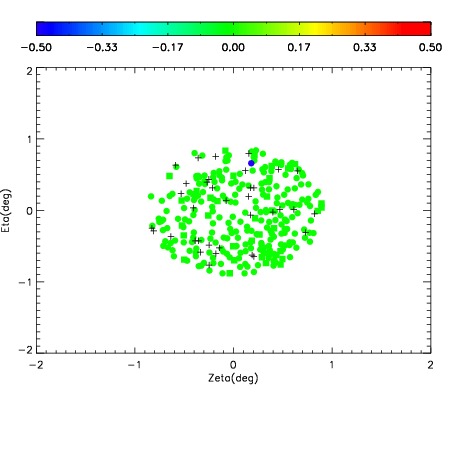
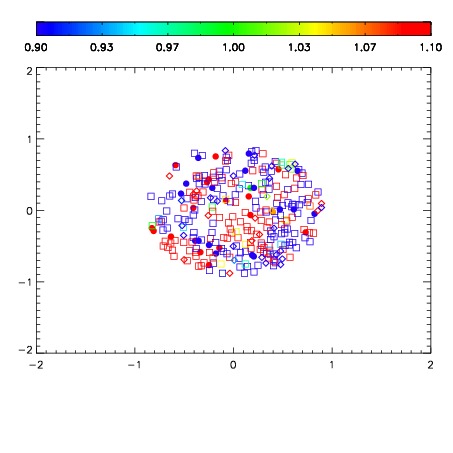
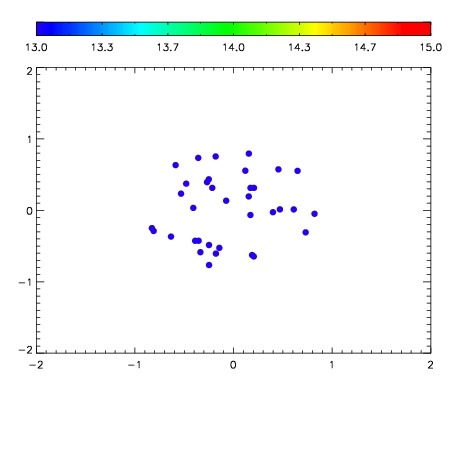

| Frame | Nreads | Zeropoints | Mag plots | Spatial mag deviation | Spatial sky 16325A emission deviations (filled: sky, open: star) | Spatial sky continuum emission | Spatial sky telluric CO2 absorption deviations (filled: H < 10) | |||||||||||||||||||||||
| 0 | 0 |
|
|
|
|
|
|
| IPAIR | NAME | SHIFT | NEWSHIFT | S/N | NAME | SHIFT | NEWSHIFT | S/N |
| 0 | 08430071 | 0.492671 | 0.00000 | 102.620 | 08430073 | 0.00134989 | 0.491321 | 104.143 |
| 1 | 08430075 | 0.489296 | 0.00337502 | 186.346 | 08430077 | 0.00317685 | 0.489494 | 215.864 |
| 2 | 08430076 | 0.489878 | 0.00279301 | 170.507 | 08430074 | 0.00243134 | 0.490240 | 158.753 |
| 3 | 08430072 | 0.492522 | 0.000149012 | 110.613 | 08430070 | 0.00000 | 0.492671 | 146.671 |