| Frame | Nreads | Zeropoints | Mag plots
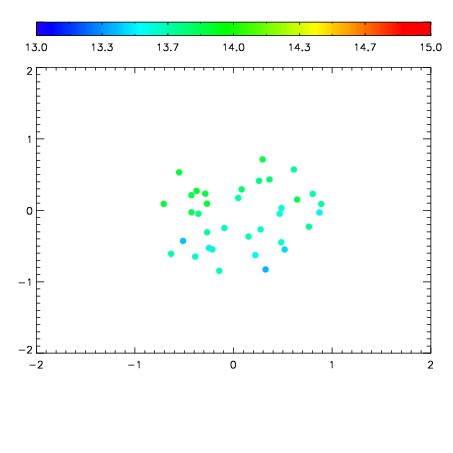
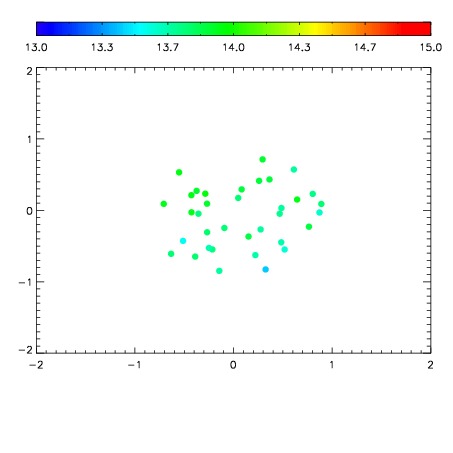
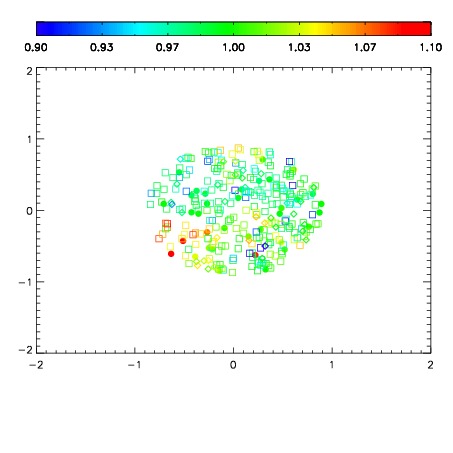
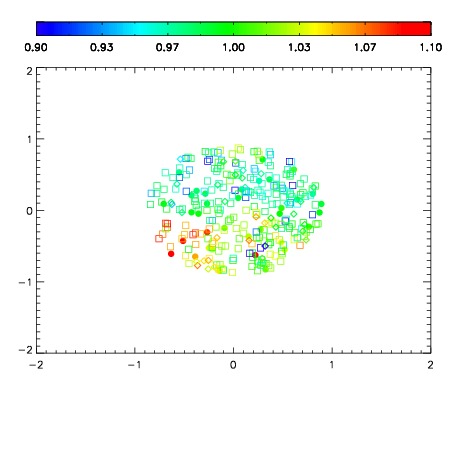
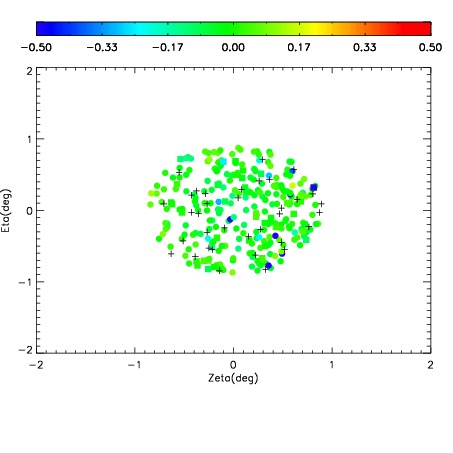
| Spatial mag deviation
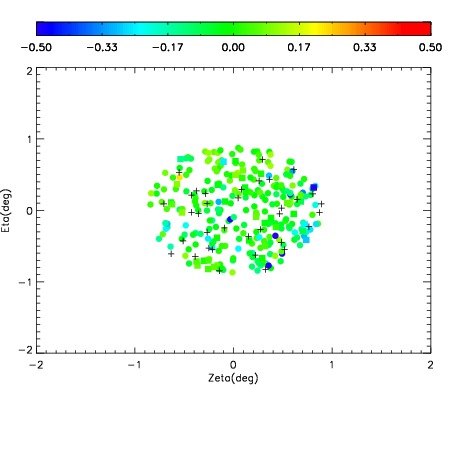
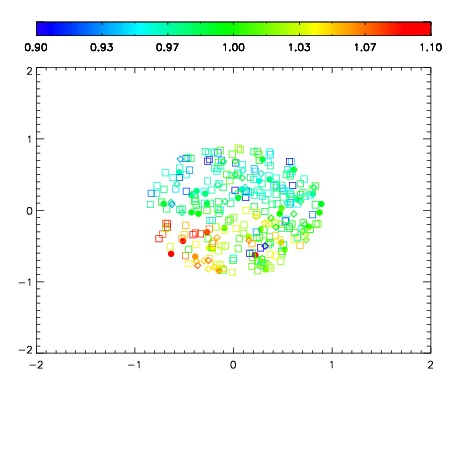
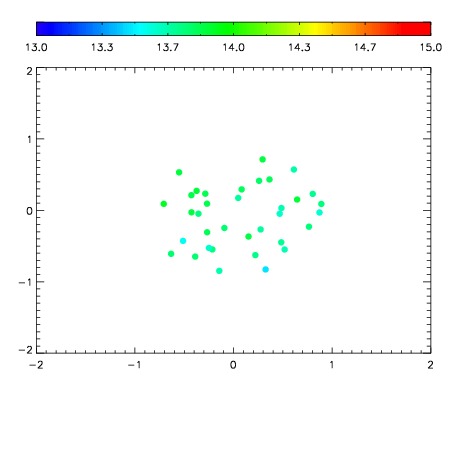
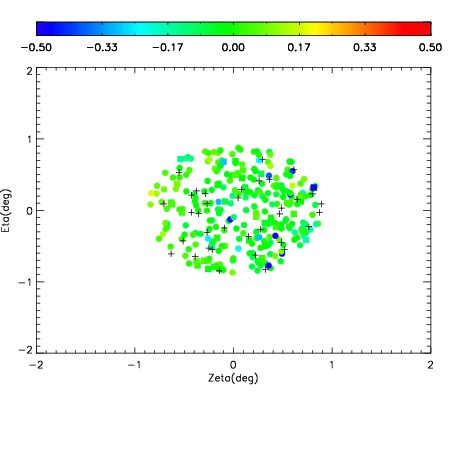
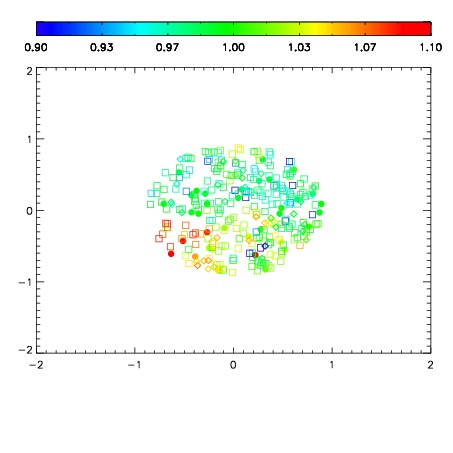
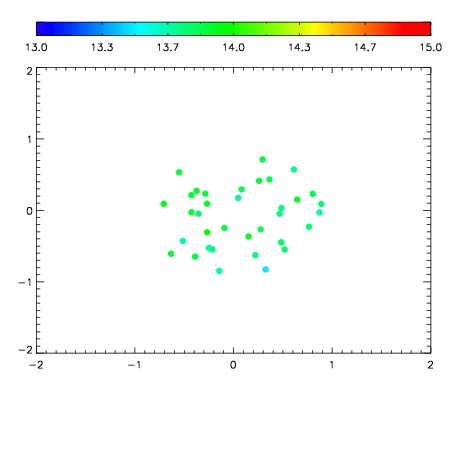
| Spatial sky 16325A emission deviations (filled: sky, open: star)
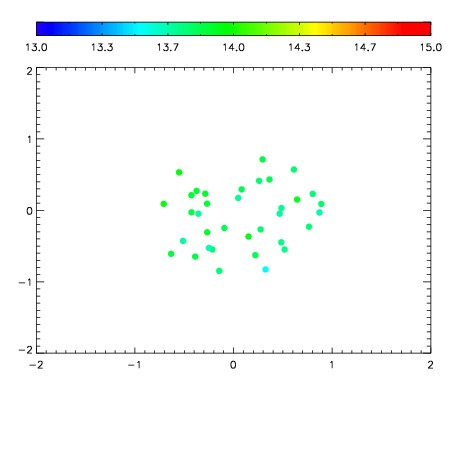
| Spatial sky continuum emission
| Spatial sky telluric CO2 absorption deviations (filled: H < 10)
|
| 8460105
| 47
| | Red | Green | Blue
| | z | | 18.33
| | znorm | | 14.15
| | sky | 14.0 | 13.7 | 13.7
| | S/N | 11.9 | 17.1 | 18.6
| | S/N(c) | 10.7 | 15.9 | 17.2
| | SN(E/C) 0.96
|
| 
| 
| 
| 
| 
|
| 8460106
| 47
| | Red | Green | Blue
| | z | | 18.53
| | znorm | | 14.35
| | sky | 14.1 | 13.8 | 13.8
| | S/N | 13.4 | 19.2 | 20.5
| | S/N(c) | 12.2 | 17.8 | 19.0
| | SN(E/C) 0.95
|
| 
| 
| 
| 
| 
|
| 8460107
| 47
| | Red | Green | Blue
| | z | | 18.29
| | znorm | | 14.11
| | sky | 13.9 | 13.8 | 13.9
| | S/N | 11.5 | 17.2 | 18.2
| | S/N(c) | 10.2 | 15.6 | 16.8
| | SN(E/C) 0.95
|
| 
| 
| 
| 
| 
|
| 8460108
| 47
| | Red | Green | Blue
| | z | | 18.39
| | znorm | | 14.21
| | sky | 14.0 | 13.8 | 13.9
| | S/N | 12.3 | 18.1 | 19.2
| | S/N(c) | 11.0 | 16.4 | 17.7
| | SN(E/C) 0.97
|
| 
| 
| 
| 
| 
|
| 8460109
| 47
| | Red | Green | Blue
| | z | | 18.37
| | znorm | | 14.19
| | sky | 14.0 | 13.8 | 13.9
| | S/N | 12.2 | 18.1 | 19.0
| | S/N(c) | 10.8 | 16.6 | 17.5
| | SN(E/C) 0.97
|
| 
| 
| 
| 
| 
|
| 8460110
| 47
| | Red | Green | Blue
| | z | | 18.51
| | znorm | | 14.33
| | sky | 13.9 | 13.8 | 13.8
| | S/N | 13.1 | 19.3 | 20.3
| | S/N(c) | 11.9 | 17.7 | 18.8
| | SN(E/C) 0.93
|
| 
| 
| 
| 
| 
|
| 8460111
| 47
| | Red | Green | Blue
| | z | | 18.27
| | znorm | | 14.09
| | sky | 14.0 | 13.8 | 13.9
| | S/N | 11.3 | 16.7 | 17.5
| | S/N(c) | 10.0 | 15.3 | 16.3
| | SN(E/C) 0.97
|
| 
| 
| 
| 
| 
|
| 8460112
| 47
| | Red | Green | Blue
| | z | | 18.64
| | znorm | | 14.46
| | sky | 13.9 | 13.8 | 13.8
| | S/N | 14.3 | 20.5 | 21.9
| | S/N(c) | 12.8 | 18.8 | 20.3
| | SN(E/C) 0.99
|
| 
| 
| 
| 
| 
|