| Red | Green | Blue | |
| z | 17.64 | ||
| znorm | Inf | ||
| sky | -Inf | -NaN | -Inf |
| S/N | 22.4 | 33.6 | 36.0 |
| S/N(c) | 0.0 | 0.0 | 0.0 |
| SN(E/C) |
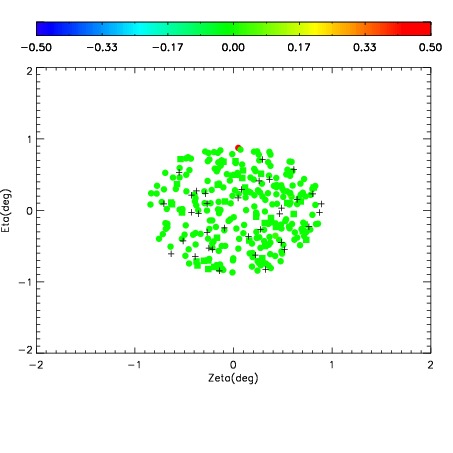
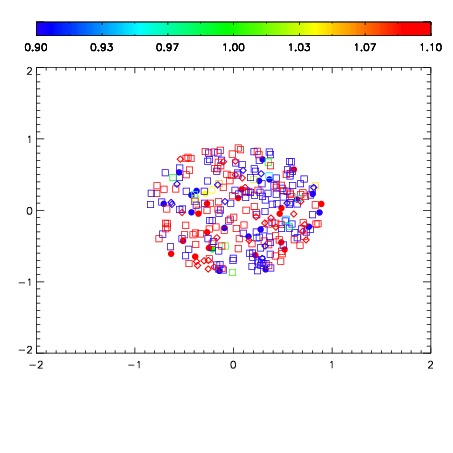


| Frame | Nreads | Zeropoints | Mag plots | Spatial mag deviation | Spatial sky 16325A emission deviations (filled: sky, open: star) | Spatial sky continuum emission | Spatial sky telluric CO2 absorption deviations (filled: H < 10) | |||||||||||||||||||||||
| 0 | 0 |
|
|
|
|
|
|
| IPAIR | NAME | SHIFT | NEWSHIFT | S/N | NAME | SHIFT | NEWSHIFT | S/N |
| 0 | 08460111 | 0.491657 | 0.00000 | 145.537 | 08460109 | 0.00556803 | 0.486089 | 151.635 |
| 1 | 08460106 | 0.488275 | 0.00338200 | 167.144 | 08460112 | 0.00604622 | 0.485611 | 168.340 |
| 2 | 08460110 | 0.489904 | 0.00175300 | 163.902 | 08460108 | 0.00587604 | 0.485781 | 154.809 |
| 3 | 08460107 | 0.490308 | 0.00134900 | 148.088 | 08460105 | 0.00000 | 0.491657 | 151.702 |