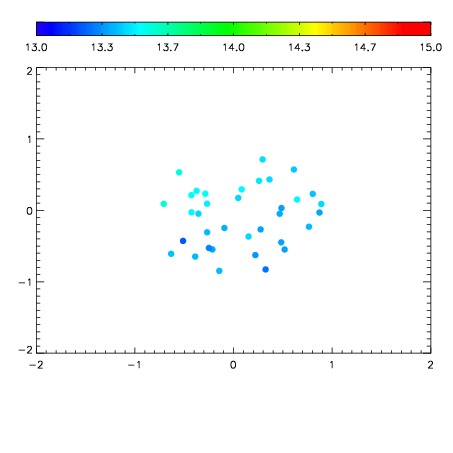
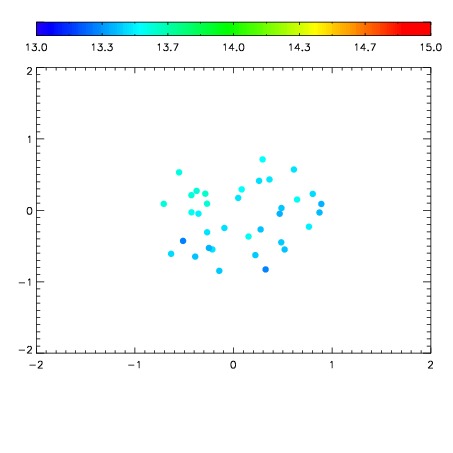
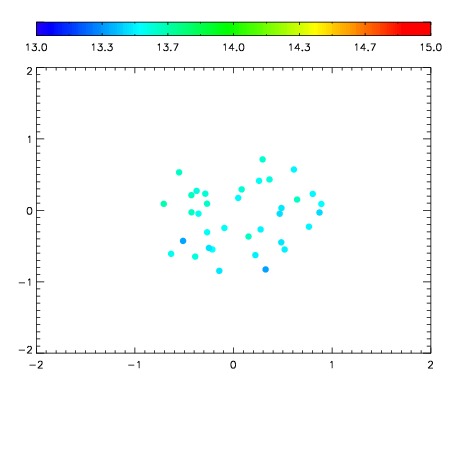
| Frame | Nreads | Zeropoints | Mag plots
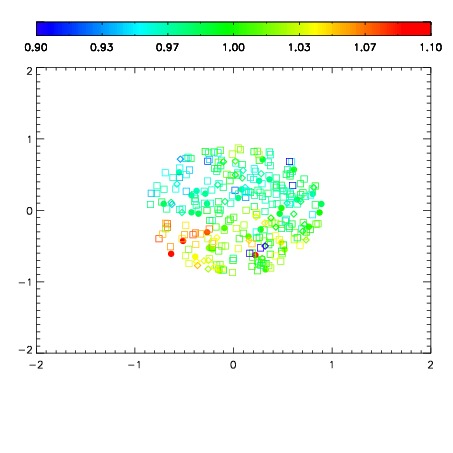
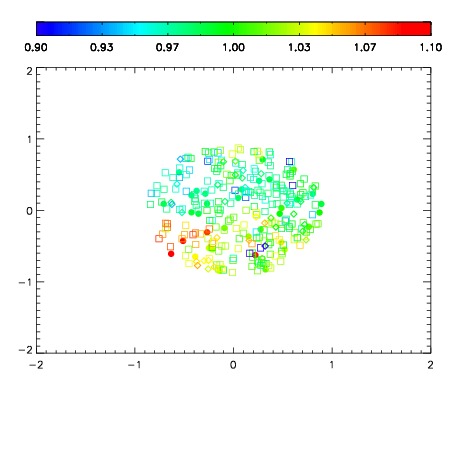
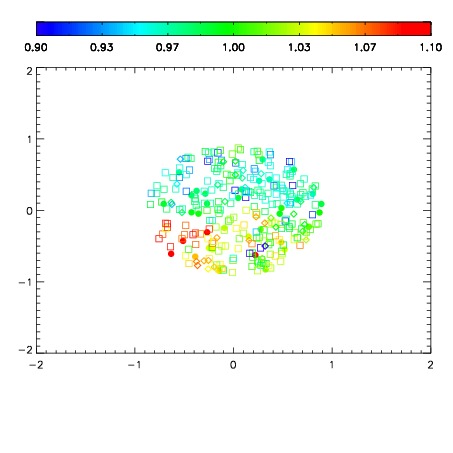
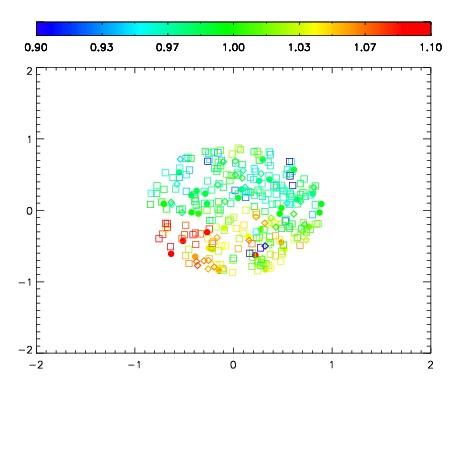
| Spatial mag deviation
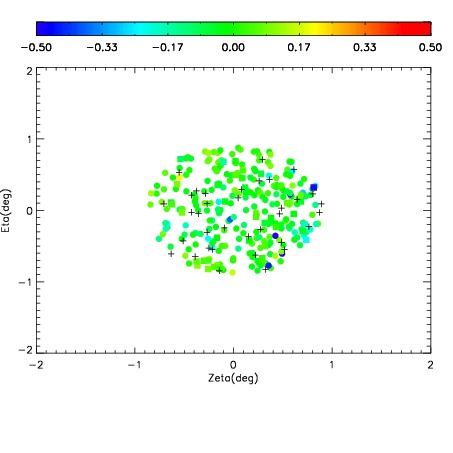
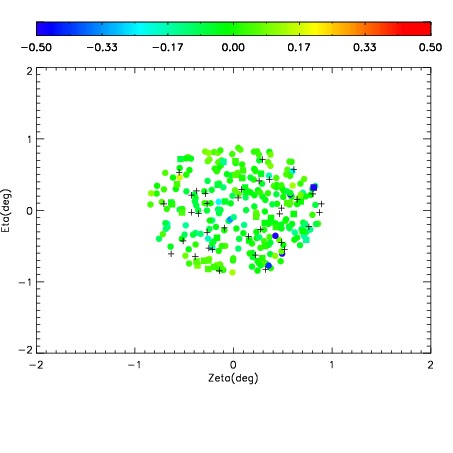
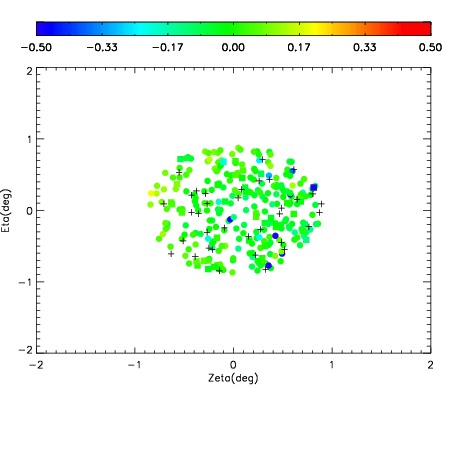
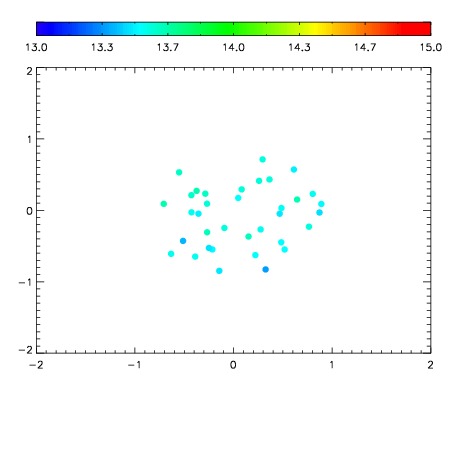
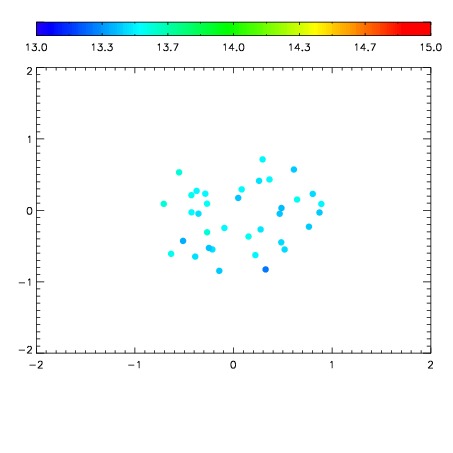
| Spatial sky 16325A emission deviations (filled: sky, open: star)
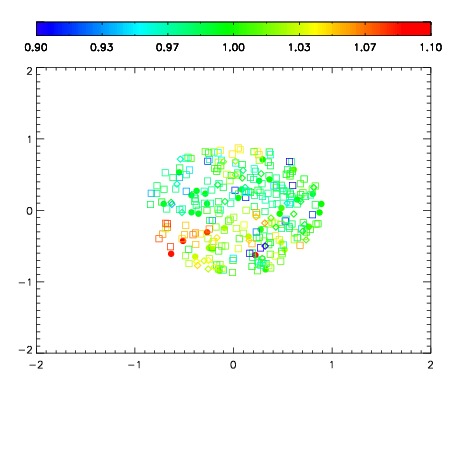
| Spatial sky continuum emission
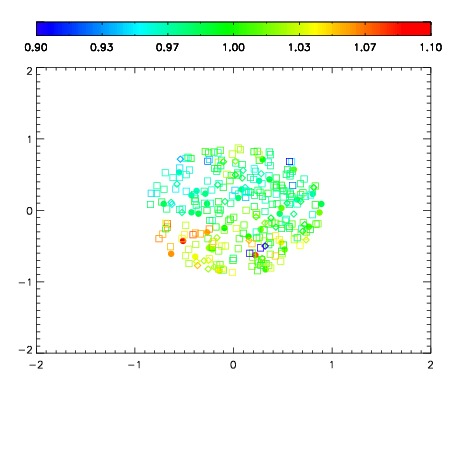
| Spatial sky telluric CO2 absorption deviations (filled: H < 10)
|
| 8470093
| 47
| | Red | Green | Blue
| | z | | 17.95
| | znorm | | 13.77
| | sky | 13.7 | 13.4 | 13.4
| | S/N | 9.3 | 13.8 | 14.4
| | S/N(c) | 8.1 | 12.5 | 13.3
| | SN(E/C) 0.96
|
| 
| 
| 
| 
| 
|
| 8470094
| 47
| | Red | Green | Blue
| | z | | 17.85
| | znorm | | 13.67
| | sky | 13.7 | 13.5 | 13.5
| | S/N | 8.6 | 12.9 | 14.0
| | S/N(c) | 7.6 | 11.5 | 12.8
| | SN(E/C) 0.99
|
| 
| 
| 
| 
| 
|
| 8470095
| 47
| | Red | Green | Blue
| | z | | 17.79
| | znorm | | 13.61
| | sky | 13.7 | 13.5 | 13.5
| | S/N | 8.3 | 12.6 | 13.2
| | S/N(c) | 7.1 | 11.3 | 12.0
| | SN(E/C) 0.99
|
| 
| 
| 
| 
| 
|
| 8470096
| 47
| | Red | Green | Blue
| | z | | 18.03
| | znorm | | 13.85
| | sky | 13.7 | 13.5 | 13.6
| | S/N | 9.6 | 14.5 | 15.2
| | S/N(c) | 8.5 | 13.1 | 14.0
| | SN(E/C) 1.00
|
| 
| 
| 
| 
| 
|
| 8470097
| 47
| | Red | Green | Blue
| | z | | 18.22
| | znorm | | 14.04
| | sky | 13.8 | 13.6 | 13.6
| | S/N | 10.9 | 16.3 | 17.1
| | S/N(c) | 9.7 | 14.7 | 15.7
| | SN(E/C) 0.97
|
| 
| 
| 
| 
| 
|
| 8470098
| 47
| | Red | Green | Blue
| | z | | 18.46
| | znorm | | 14.28
| | sky | 13.7 | 13.6 | 13.6
| | S/N | 12.7 | 18.6 | 19.6
| | S/N(c) | 11.4 | 17.0 | 18.2
| | SN(E/C) 0.94
|
| 
| 
| 
| 
| 
|
| 8470099
| 47
| | Red | Green | Blue
| | z | | 18.26
| | znorm | | 14.08
| | sky | 13.7 | 13.6 | 13.5
| | S/N | 11.3 | 16.5 | 17.3
| | S/N(c) | 10.0 | 15.0 | 16.0
| | SN(E/C) 0.99
|
| 
| 
| 
| 
| 
|
| 8470100
| 47
| | Red | Green | Blue
| | z | | 18.50
| | znorm | | 14.32
| | sky | 13.7 | 13.5 | 13.5
| | S/N | 13.1 | 19.0 | 20.0
| | S/N(c) | 11.8 | 17.4 | 18.5
| | SN(E/C) 0.95
|
| 
| 
| 
| 
| 
|