| Red | Green | Blue | |
| z | 17.64 | ||
| znorm | Inf | ||
| sky | -Inf | -Inf | -Inf |
| S/N | 18.6 | 28.2 | 30.1 |
| S/N(c) | 0.0 | 0.0 | 0.0 |
| SN(E/C) |
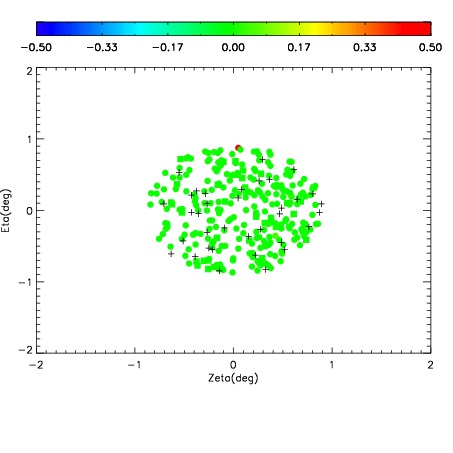
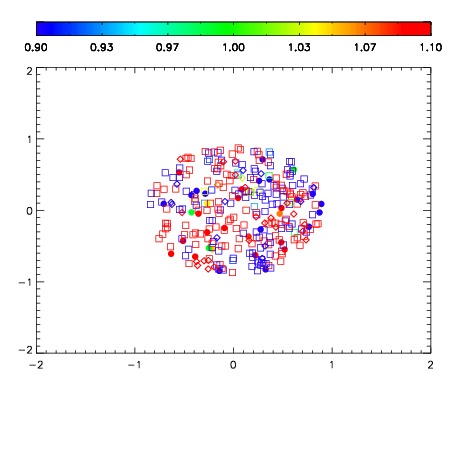


| Frame | Nreads | Zeropoints | Mag plots | Spatial mag deviation | Spatial sky 16325A emission deviations (filled: sky, open: star) | Spatial sky continuum emission | Spatial sky telluric CO2 absorption deviations (filled: H < 10) | |||||||||||||||||||||||
| 0 | 0 |
|
|
|
|
|
|
| IPAIR | NAME | SHIFT | NEWSHIFT | S/N | NAME | SHIFT | NEWSHIFT | S/N |
| 0 | 08470095 | 0.485346 | 0.00000 | 114.909 | 08470093 | 0.00000 | 0.485346 | 126.595 |
| 1 | 08470098 | 0.483362 | 0.00198400 | 157.440 | 08470100 | 0.0514723 | 0.433874 | 157.351 |
| 2 | 08470099 | 0.485187 | 0.000158995 | 139.923 | 08470097 | 0.00258681 | 0.482759 | 139.606 |
| 3 | 08470094 | 0.484807 | 0.000538975 | 119.586 | 08470096 | 0.00509161 | 0.480254 | 130.463 |