| Red | Green | Blue | |
| z | 17.64 | ||
| znorm | Inf | ||
| sky | -Inf | -Inf | -Inf |
| S/N | 33.9 | 53.3 | 57.3 |
| S/N(c) | 0.0 | 0.0 | 0.0 |
| SN(E/C) |
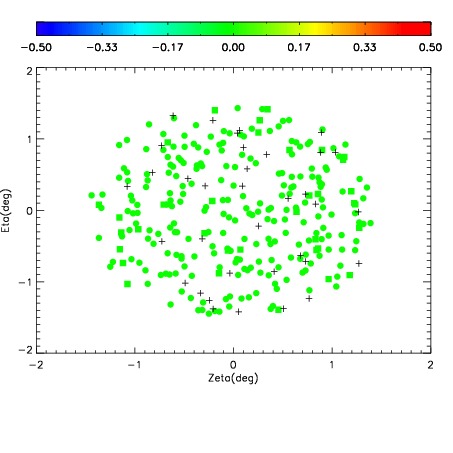
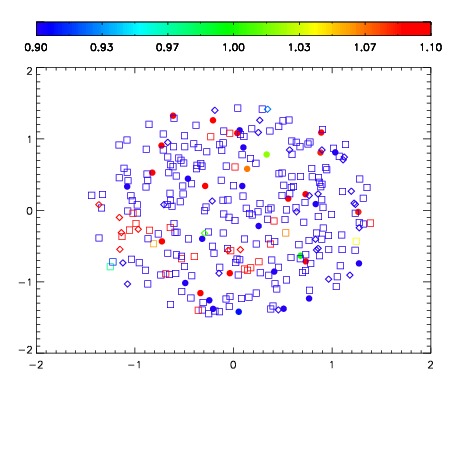
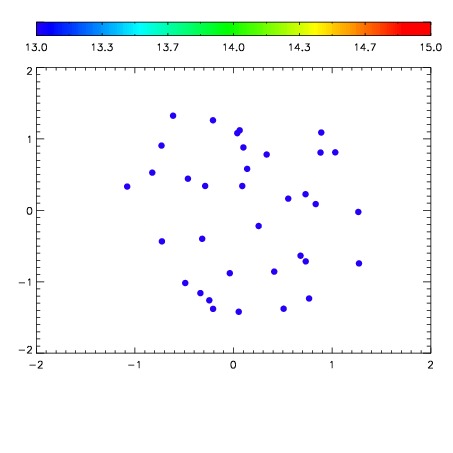

| Frame | Nreads | Zeropoints | Mag plots | Spatial mag deviation | Spatial sky 16325A emission deviations (filled: sky, open: star) | Spatial sky continuum emission | Spatial sky telluric CO2 absorption deviations (filled: H < 10) | |||||||||||||||||||||||
| 0 | 0 |
|
|
|
|
|
|
| IPAIR | NAME | SHIFT | NEWSHIFT | S/N | NAME | SHIFT | NEWSHIFT | S/N |
| 0 | 08150076 | 0.514530 | 0.00000 | 136.856 | 08150081 | -0.00569785 | 0.520228 | 148.365 |
| 1 | 08150079 | 0.492462 | 0.0220680 | 151.709 | 08150074 | -0.00347468 | 0.518005 | 158.055 |
| 2 | 08150071 | 0.494311 | 0.0202190 | 150.315 | 08150070 | 0.00000 | 0.514530 | 153.320 |
| 3 | 08150072 | 0.511532 | 0.00299799 | 142.435 | 08150078 | -0.00657180 | 0.521102 | 149.797 |
| 4 | 08150080 | 0.507364 | 0.00716603 | 135.404 | 08150073 | -0.00265185 | 0.517182 | 145.902 |
| 5 | 08150075 | 0.495186 | 0.0193440 | 132.277 | 08150077 | -0.00476893 | 0.519299 | 143.361 |