| Red | Green | Blue | |
| z | 17.64 | ||
| znorm | Inf | ||
| sky | -Inf | -Inf | -Inf |
| S/N | 33.7 | 51.4 | 57.0 |
| S/N(c) | 0.0 | 0.0 | 0.0 |
| SN(E/C) |
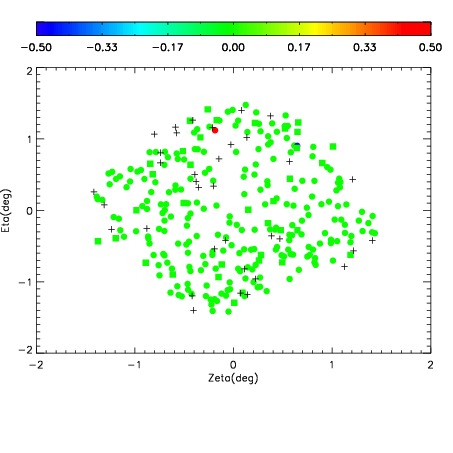
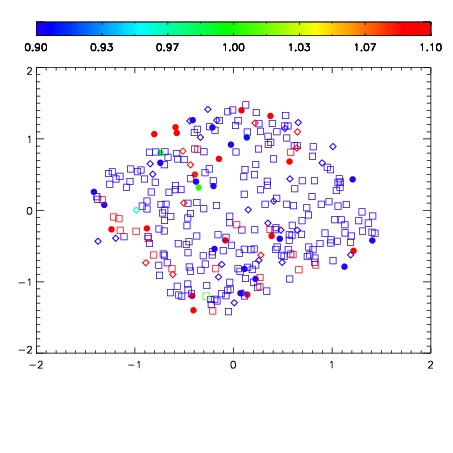
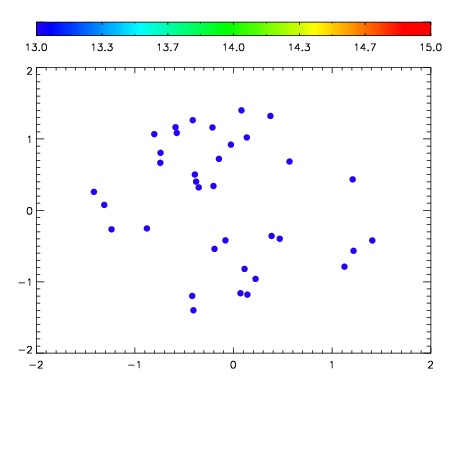

| Frame | Nreads | Zeropoints | Mag plots | Spatial mag deviation | Spatial sky 16325A emission deviations (filled: sky, open: star) | Spatial sky continuum emission | Spatial sky telluric CO2 absorption deviations (filled: H < 10) | |||||||||||||||||||||||
| 0 | 0 |
|
|
|
|
|
|
| IPAIR | NAME | SHIFT | NEWSHIFT | S/N | NAME | SHIFT | NEWSHIFT | S/N |
| 0 | 08850016 | 0.477195 | 0.00000 | 223.470 | 08850018 | -0.00514352 | 0.482339 | 221.654 |
| 1 | 08850017 | 0.476726 | 0.000468999 | 221.645 | 08850011 | 0.00000 | 0.477195 | 218.371 |
| 2 | 08850012 | 0.474606 | 0.00258899 | 218.705 | 08850014 | -0.00509901 | 0.482294 | 214.770 |
| 3 | 08850013 | 0.474317 | 0.00287798 | 218.090 | 08850015 | -0.00486419 | 0.482059 | 209.067 |