| Red | Green | Blue | |
| z | 17.64 | ||
| znorm | Inf | ||
| sky | -Inf | -Inf | -Inf |
| S/N | 13.1 | 21.8 | 22.9 |
| S/N(c) | 0.0 | 0.0 | 0.0 |
| SN(E/C) |
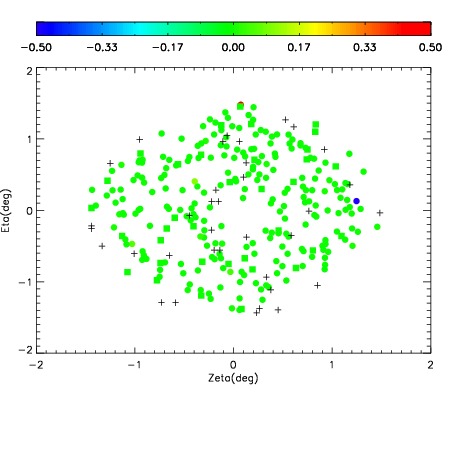
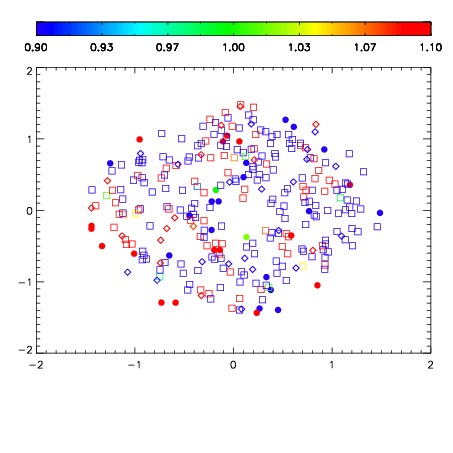
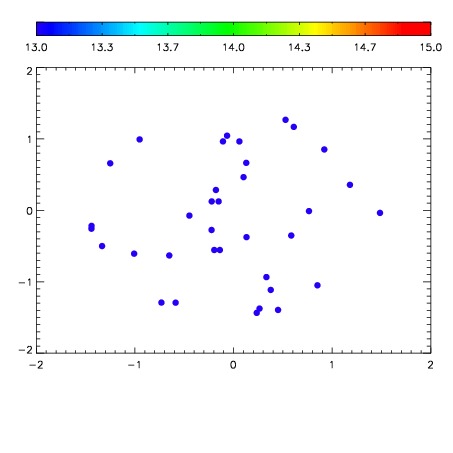

| Frame | Nreads | Zeropoints | Mag plots | Spatial mag deviation | Spatial sky 16325A emission deviations (filled: sky, open: star) | Spatial sky continuum emission | Spatial sky telluric CO2 absorption deviations (filled: H < 10) | |||||||||||||||||||||||
| 0 | 0 |
|
|
|
|
|
|
| IPAIR | NAME | SHIFT | NEWSHIFT | S/N | NAME | SHIFT | NEWSHIFT | S/N |
| 0 | 08790011 | 0.477490 | 0.00000 | 45.8389 | 08790010 | 0.00000 | 0.477490 | 28.1303 |
| 1 | 08790012 | 0.476381 | 0.00110900 | 119.851 | 08790014 | 0.000133180 | 0.477357 | 147.154 |
| 2 | 08790015 | 0.475456 | 0.00203401 | 92.2564 | 08790017 | 0.000394551 | 0.477095 | 135.758 |
| 3 | 08790016 | 0.475990 | 0.00150001 | 82.1369 | 08790013 | 0.000723392 | 0.476767 | 112.729 |