| Red | Green | Blue | |
| z | 17.64 | ||
| znorm | Inf | ||
| sky | -Inf | -NaN | -Inf |
| S/N | 29.9 | 45.8 | 50.6 |
| S/N(c) | 0.0 | 0.0 | 0.0 |
| SN(E/C) |
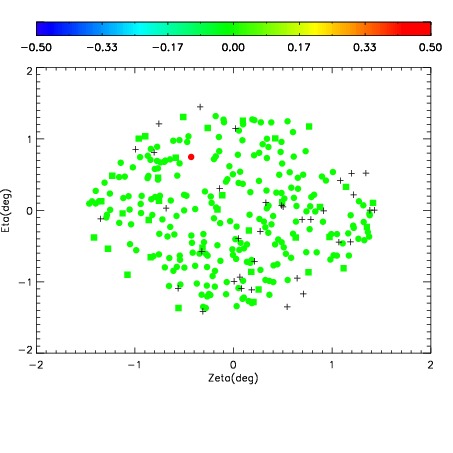
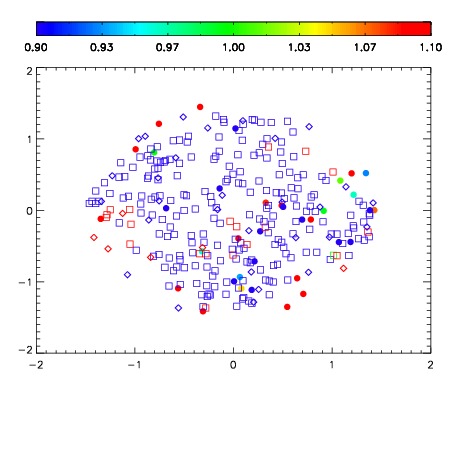
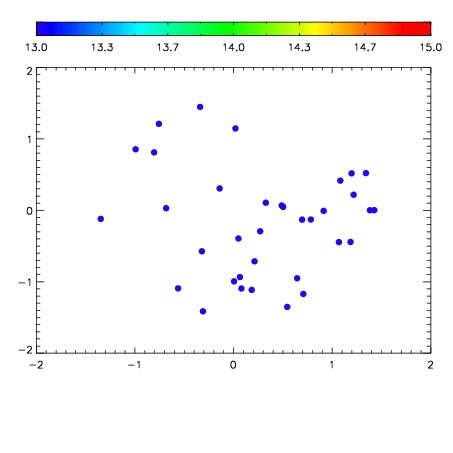

| Frame | Nreads | Zeropoints | Mag plots | Spatial mag deviation | Spatial sky 16325A emission deviations (filled: sky, open: star) | Spatial sky continuum emission | Spatial sky telluric CO2 absorption deviations (filled: H < 10) | |||||||||||||||||||||||
| 0 | 0 |
|
|
|
|
|
|
| IPAIR | NAME | SHIFT | NEWSHIFT | S/N | NAME | SHIFT | NEWSHIFT | S/N |
| 0 | 08810039 | 0.473213 | 0.00000 | 217.940 | 08810037 | 0.00000 | 0.473213 | 216.818 |
| 1 | 08810042 | 0.472540 | 0.000672996 | 222.278 | 08810041 | 0.00285390 | 0.470359 | 222.929 |
| 2 | 08810038 | 0.472912 | 0.000300974 | 218.259 | 08810040 | 0.00222756 | 0.470985 | 222.610 |