| Red | Green | Blue | |
| z | 17.64 | ||
| znorm | Inf | ||
| sky | -Inf | -Inf | -Inf |
| S/N | 32.1 | 49.8 | 58.1 |
| S/N(c) | 0.0 | 0.0 | 0.0 |
| SN(E/C) |
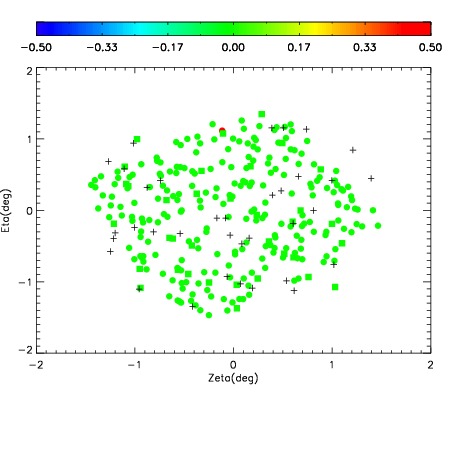
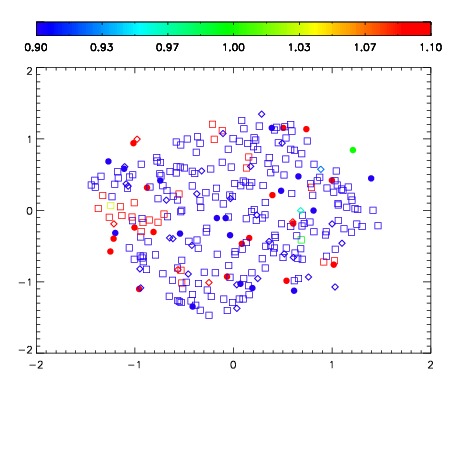
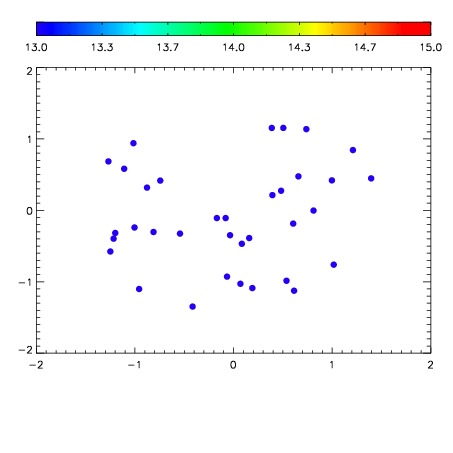

| Frame | Nreads | Zeropoints | Mag plots | Spatial mag deviation | Spatial sky 16325A emission deviations (filled: sky, open: star) | Spatial sky continuum emission | Spatial sky telluric CO2 absorption deviations (filled: H < 10) | |||||||||||||||||||||||
| 0 | 0 |
|
|
|
|
|
|
| IPAIR | NAME | SHIFT | NEWSHIFT | S/N | NAME | SHIFT | NEWSHIFT | S/N |
| 0 | 08780040 | 0.471906 | 0.00000 | 179.476 | 08780037 | 0.00551153 | 0.466394 | 176.261 |
| 1 | 08780039 | 0.471809 | 9.70066e-05 | 181.277 | 08780038 | 0.00537161 | 0.466534 | 182.117 |
| 2 | 08780035 | 0.470730 | 0.00117600 | 179.644 | 08780041 | 0.00362833 | 0.468278 | 180.381 |
| 3 | 08780036 | 0.471596 | 0.000310004 | 178.643 | 08780034 | 0.00000 | 0.471906 | 173.139 |