| Red | Green | Blue | |
| z | 17.64 | ||
| znorm | Inf | ||
| sky | -Inf | -Inf | -Inf |
| S/N | 23.8 | 35.4 | 37.8 |
| S/N(c) | 0.0 | 0.0 | 0.0 |
| SN(E/C) |
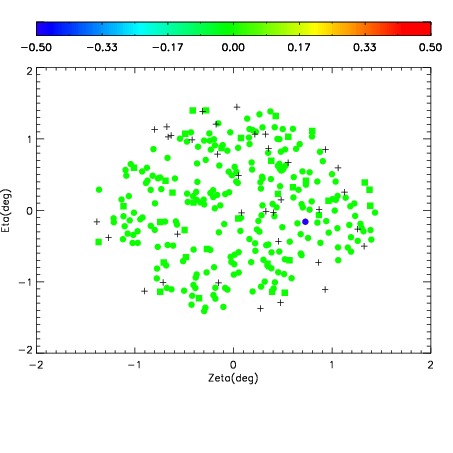
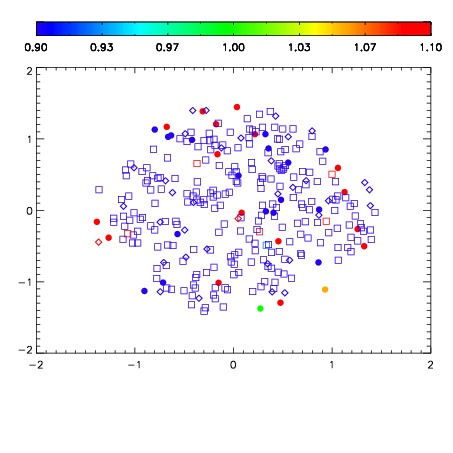
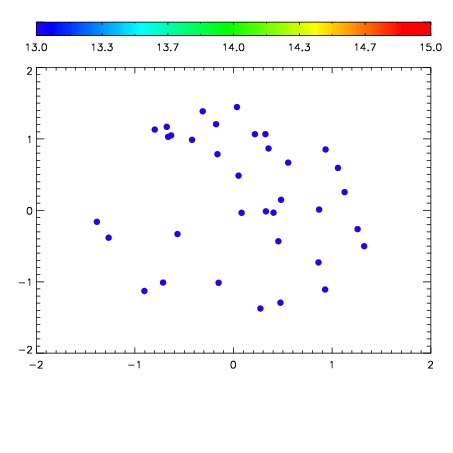

| Frame | Nreads | Zeropoints | Mag plots | Spatial mag deviation | Spatial sky 16325A emission deviations (filled: sky, open: star) | Spatial sky continuum emission | Spatial sky telluric CO2 absorption deviations (filled: H < 10) | |||||||||||||||||||||||
| 0 | 0 |
|
|
|
|
|
|
| IPAIR | NAME | SHIFT | NEWSHIFT | S/N | NAME | SHIFT | NEWSHIFT | S/N |
| 0 | 08980011 | 0.471899 | 0.00000 | 189.792 | 08980014 | 0.0107834 | 0.461116 | 110.736 |
| 1 | 08980015 | 0.465245 | 0.00665399 | 223.275 | 08980010 | 0.00000 | 0.471899 | 218.092 |
| 2 | 08980012 | 0.468330 | 0.00356901 | 221.198 | 08980013 | 0.00693685 | 0.464962 | 174.561 |