| Red | Green | Blue | |
| z | 17.64 | ||
| znorm | Inf | ||
| sky | -Inf | -Inf | -Inf |
| S/N | 35.9 | 53.3 | 59.6 |
| S/N(c) | 0.0 | 0.0 | 0.0 |
| SN(E/C) |
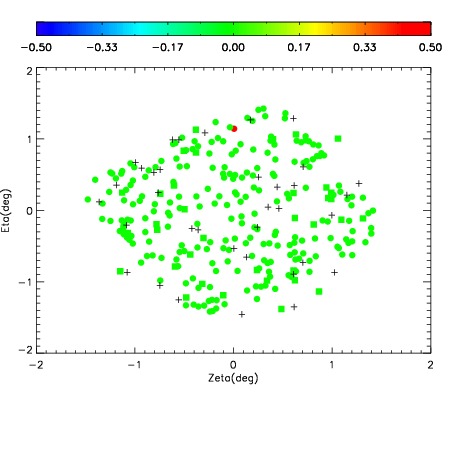
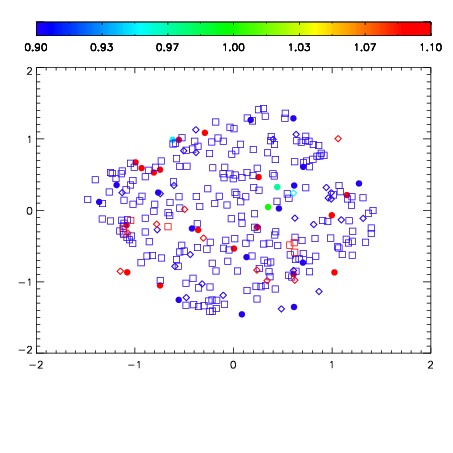
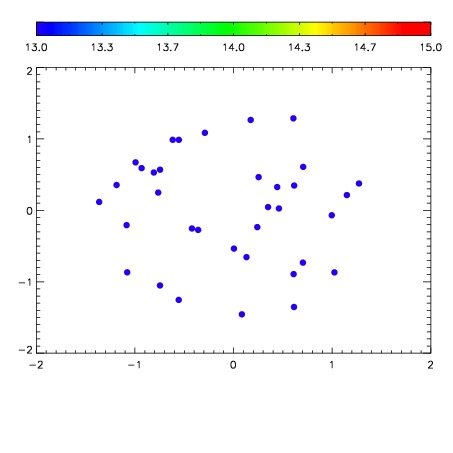

| Frame | Nreads | Zeropoints | Mag plots | Spatial mag deviation | Spatial sky 16325A emission deviations (filled: sky, open: star) | Spatial sky continuum emission | Spatial sky telluric CO2 absorption deviations (filled: H < 10) | |||||||||||||||||||||||
| 0 | 0 |
|
|
|
|
|
|
| IPAIR | NAME | SHIFT | NEWSHIFT | S/N | NAME | SHIFT | NEWSHIFT | S/N |
| 0 | 08210049 | 0.499001 | 0.00000 | 181.997 | 08210048 | 0.00000 | 0.499001 | 179.190 |
| 1 | 08210053 | 0.497340 | 0.00166100 | 185.408 | 08210055 | -0.00403776 | 0.503039 | 185.758 |
| 2 | 08210054 | 0.497631 | 0.00136998 | 184.841 | 08210052 | -0.00468165 | 0.503683 | 183.030 |
| 3 | 08210050 | 0.497378 | 0.00162300 | 184.095 | 08210051 | -0.00432944 | 0.503330 | 181.154 |