| Red | Green | Blue | |
| z | 17.64 | ||
| znorm | Inf | ||
| sky | -Inf | -NaN | -Inf |
| S/N | 21.9 | 34.8 | 34.8 |
| S/N(c) | 0.0 | 0.0 | 0.0 |
| SN(E/C) |
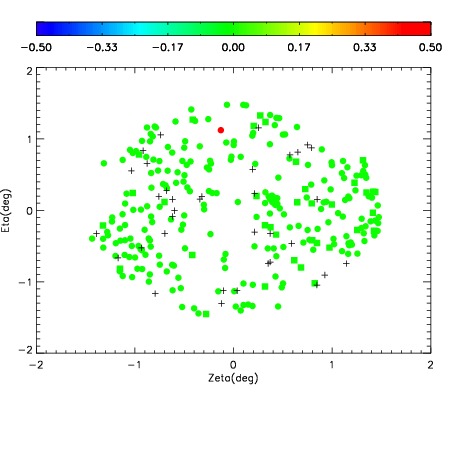
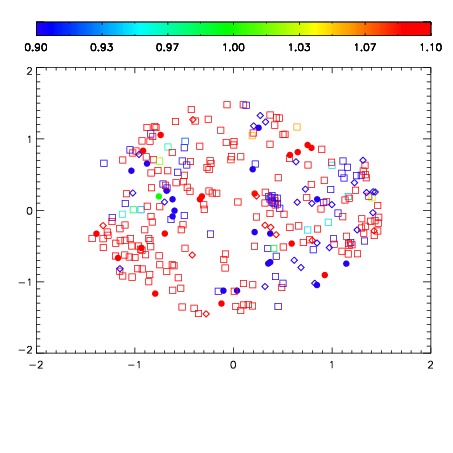
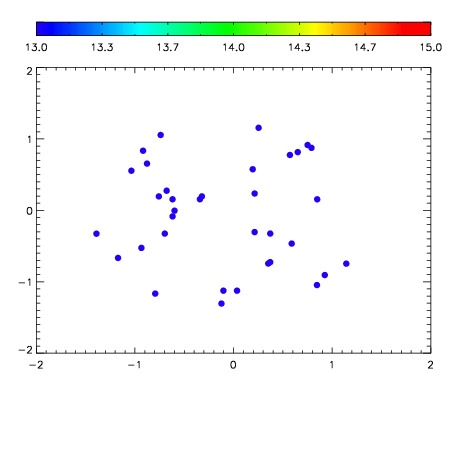

| Frame | Nreads | Zeropoints | Mag plots | Spatial mag deviation | Spatial sky 16325A emission deviations (filled: sky, open: star) | Spatial sky continuum emission | Spatial sky telluric CO2 absorption deviations (filled: H < 10) | |||||||||||||||||||||||
| 0 | 0 |
|
|
|
|
|
|
| IPAIR | NAME | SHIFT | NEWSHIFT | S/N | NAME | SHIFT | NEWSHIFT | S/N |
| 0 | 08630024 | 0.487467 | 0.00000 | 182.125 | 08630019 | 0.00000 | 0.487467 | 181.795 |
| 1 | 08630020 | 0.486962 | 0.000505000 | 186.088 | 08630023 | 0.00113742 | 0.486330 | 186.070 |
| 2 | 08630021 | 0.487007 | 0.000459999 | 183.356 | 08630022 | 0.00193414 | 0.485533 | 182.215 |