| Red | Green | Blue | |
| z | 17.64 | ||
| znorm | Inf | ||
| sky | -Inf | -Inf | -Inf |
| S/N | 23.2 | 35.9 | 35.6 |
| S/N(c) | 0.0 | 0.0 | 0.0 |
| SN(E/C) |
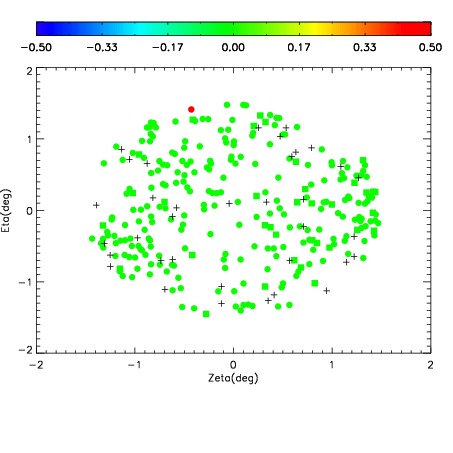
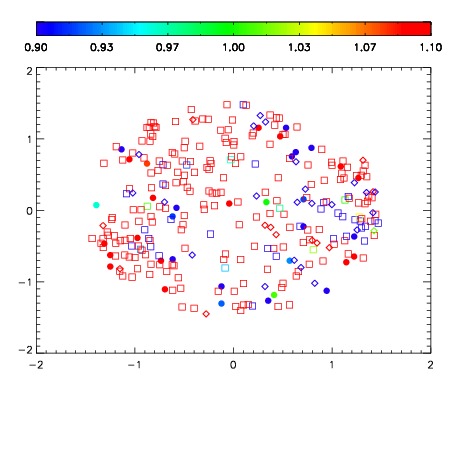
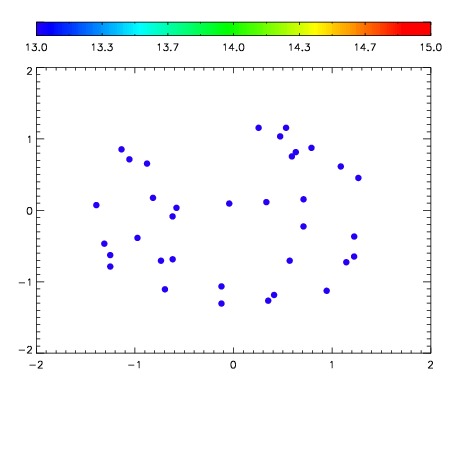

| Frame | Nreads | Zeropoints | Mag plots | Spatial mag deviation | Spatial sky 16325A emission deviations (filled: sky, open: star) | Spatial sky continuum emission | Spatial sky telluric CO2 absorption deviations (filled: H < 10) | |||||||||||||||||||||||
| 0 | 0 |
|
|
|
|
|
|
| IPAIR | NAME | SHIFT | NEWSHIFT | S/N | NAME | SHIFT | NEWSHIFT | S/N |
| 0 | 09060040 | 0.484187 | 0.00000 | 183.288 | 09060039 | 0.00297297 | 0.481214 | 186.449 |
| 1 | 09060037 | 0.479922 | 0.00426501 | 187.858 | 09060035 | 0.00000 | 0.484187 | 192.608 |
| 2 | 09060036 | 0.479665 | 0.00452200 | 187.756 | 09060038 | 0.00263971 | 0.481547 | 191.649 |