| Red | Green | Blue | |
| z | 17.64 | ||
| znorm | Inf | ||
| sky | -Inf | -Inf | -Inf |
| S/N | 24.4 | 38.0 | 37.4 |
| S/N(c) | 0.0 | 0.0 | 0.0 |
| SN(E/C) |
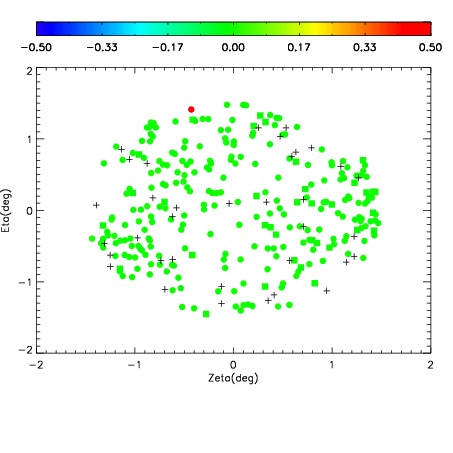
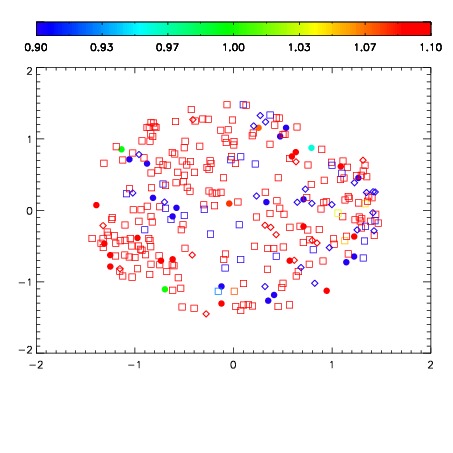
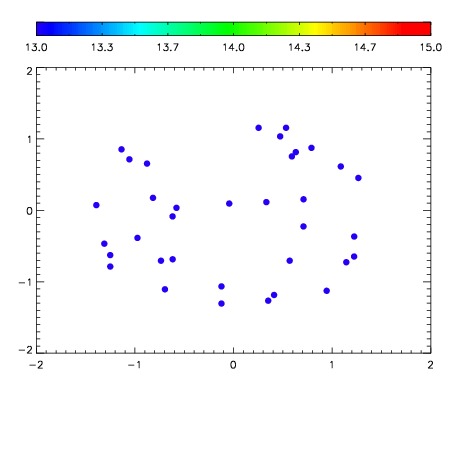

| Frame | Nreads | Zeropoints | Mag plots | Spatial mag deviation | Spatial sky 16325A emission deviations (filled: sky, open: star) | Spatial sky continuum emission | Spatial sky telluric CO2 absorption deviations (filled: H < 10) | |||||||||||||||||||||||
| 0 | 0 |
|
|
|
|
|
|
| IPAIR | NAME | SHIFT | NEWSHIFT | S/N | NAME | SHIFT | NEWSHIFT | S/N |
| 0 | 09100017 | 0.482749 | 0.00000 | 168.181 | 09100018 | 0.00354807 | 0.479201 | 162.933 |
| 1 | 09100016 | 0.482448 | 0.000300974 | 176.740 | 09100015 | 0.00332634 | 0.479423 | 185.188 |
| 2 | 09100013 | 0.482473 | 0.000275999 | 176.309 | 09100014 | 0.00324010 | 0.479509 | 180.157 |
| 3 | 09100012 | 0.482286 | 0.000462979 | 175.610 | 09100011 | 0.00000 | 0.482749 | 173.958 |