| Red | Green | Blue | |
| z | 17.64 | ||
| znorm | Inf | ||
| sky | -NaN | -Inf | -Inf |
| S/N | 23.5 | 38.1 | 38.1 |
| S/N(c) | 0.0 | 0.0 | 0.0 |
| SN(E/C) |
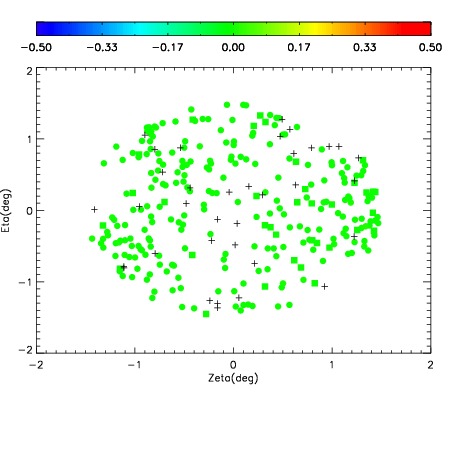
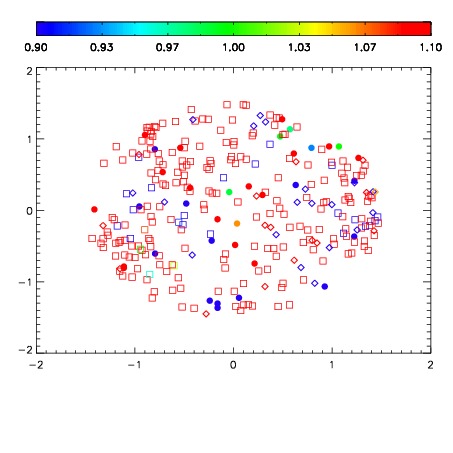


| Frame | Nreads | Zeropoints | Mag plots | Spatial mag deviation | Spatial sky 16325A emission deviations (filled: sky, open: star) | Spatial sky continuum emission | Spatial sky telluric CO2 absorption deviations (filled: H < 10) | |||||||||||||||||||||||
| 0 | 0 |
|
|
|
|
|
|
| IPAIR | NAME | SHIFT | NEWSHIFT | S/N | NAME | SHIFT | NEWSHIFT | S/N |
| 0 | 09780019 | 0.517369 | 0.00000 | 186.779 | 09780021 | 0.00285754 | 0.514511 | 181.889 |
| 1 | 09780020 | 0.517099 | 0.000269949 | 185.436 | 09780014 | 0.00000 | 0.517369 | 175.987 |
| 2 | 09780015 | 0.515440 | 0.00192899 | 176.255 | 09780018 | 0.000309929 | 0.517059 | 172.337 |
| 3 | 09780016 | 0.515255 | 0.00211400 | 161.744 | 09780017 | -0.000597374 | 0.517966 | 159.111 |