| Red | Green | Blue | |
| z | 17.64 | ||
| znorm | Inf | ||
| sky | -NaN | -Inf | -Inf |
| S/N | 26.3 | 44.8 | 47.2 |
| S/N(c) | 0.0 | 0.0 | 0.0 |
| SN(E/C) |
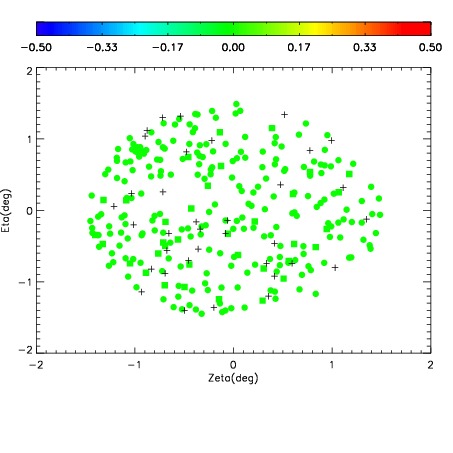

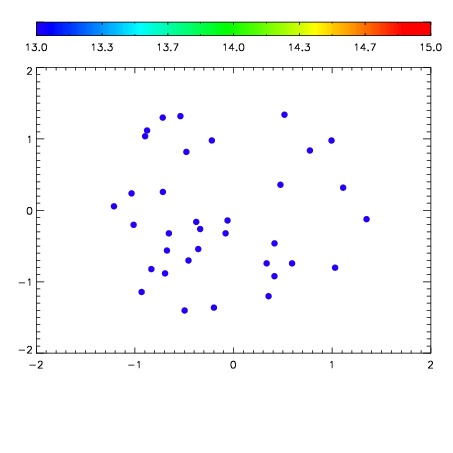

| Frame | Nreads | Zeropoints | Mag plots | Spatial mag deviation | Spatial sky 16325A emission deviations (filled: sky, open: star) | Spatial sky continuum emission | Spatial sky telluric CO2 absorption deviations (filled: H < 10) | |||||||||||||||||||||||
| 0 | 0 |
|
|
|
|
|
|
| IPAIR | NAME | SHIFT | NEWSHIFT | S/N | NAME | SHIFT | NEWSHIFT | S/N |
| 0 | 08660017 | 0.490048 | 0.00000 | 171.835 | 08660018 | 0.00607233 | 0.483976 | 161.141 |
| 1 | 08660013 | 0.489068 | 0.000979990 | 174.581 | 08660014 | 0.00336391 | 0.486684 | 175.512 |
| 2 | 08660016 | 0.488748 | 0.00129998 | 173.679 | 08660015 | 0.00387177 | 0.486176 | 171.478 |
| 3 | 08660012 | 0.489283 | 0.000764996 | 171.883 | 08660011 | 0.00000 | 0.490048 | 171.343 |