| Red | Green | Blue | |
| z | 17.64 | ||
| znorm | Inf | ||
| sky | -Inf | -Inf | -Inf |
| S/N | 11.8 | 20.6 | 24.5 |
| S/N(c) | 0.0 | 0.0 | 0.0 |
| SN(E/C) |
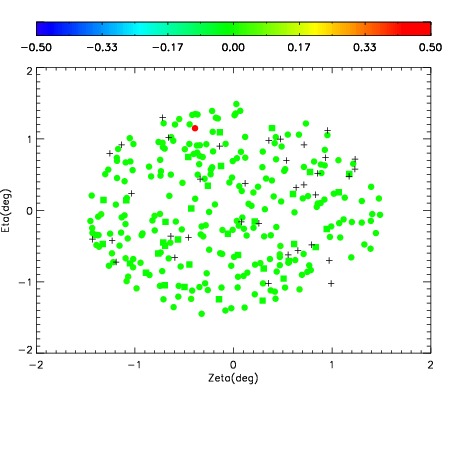
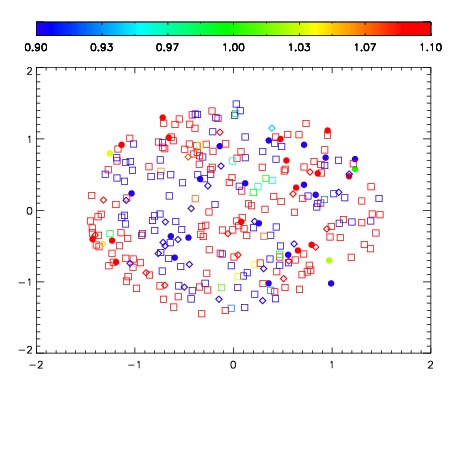


| Frame | Nreads | Zeropoints | Mag plots | Spatial mag deviation | Spatial sky 16325A emission deviations (filled: sky, open: star) | Spatial sky continuum emission | Spatial sky telluric CO2 absorption deviations (filled: H < 10) | |||||||||||||||||||||||
| 0 | 0 |
|
|
|
|
|
|
| IPAIR | NAME | SHIFT | NEWSHIFT | S/N | NAME | SHIFT | NEWSHIFT | S/N |
| 0 | 12030083 | 0.504077 | 0.00000 | 71.9125 | 12030084 | 0.00168338 | 0.502394 | 77.7661 |
| 1 | 12030087 | 0.501210 | 0.00286704 | 109.358 | 12030088 | 0.000331908 | 0.503745 | 115.381 |
| 2 | 12030086 | 0.500446 | 0.00363100 | 100.860 | 12030085 | 0.00128242 | 0.502795 | 90.3299 |
| 3 | 12030082 | 0.502308 | 0.00176901 | 52.0750 | 12030081 | 0.00000 | 0.504077 | 68.2327 |