| Red | Green | Blue | |
| z | 17.64 | ||
| znorm | Inf | ||
| sky | -Inf | -Inf | -Inf |
| S/N | 31.5 | 52.8 | 57.8 |
| S/N(c) | 0.0 | 0.0 | 0.0 |
| SN(E/C) |
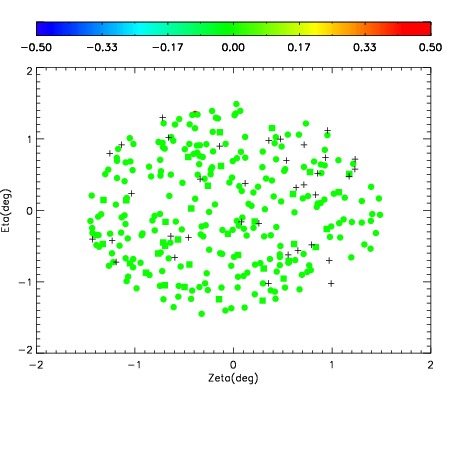

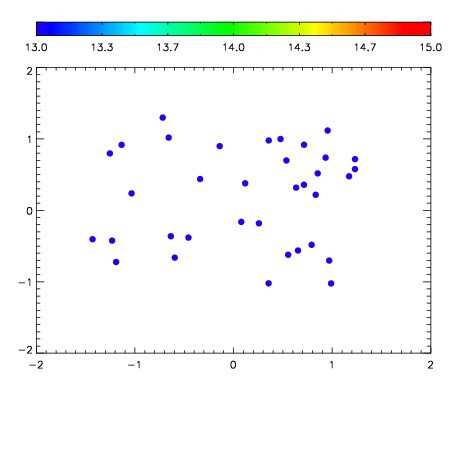

| Frame | Nreads | Zeropoints | Mag plots | Spatial mag deviation | Spatial sky 16325A emission deviations (filled: sky, open: star) | Spatial sky continuum emission | Spatial sky telluric CO2 absorption deviations (filled: H < 10) | |||||||||||||||||||||||
| 0 | 0 |
|
|
|
|
|
|
| IPAIR | NAME | SHIFT | NEWSHIFT | S/N | NAME | SHIFT | NEWSHIFT | S/N |
| 0 | 12400043 | 0.497536 | 0.00000 | 168.446 | 12400044 | 0.00181501 | 0.495721 | 167.972 |
| 1 | 12400046 | 0.496543 | 0.000993013 | 172.085 | 12400045 | 0.00108079 | 0.496455 | 168.876 |
| 2 | 12400042 | 0.497273 | 0.000263005 | 164.842 | 12400041 | 0.00125555 | 0.496280 | 165.426 |
| 3 | 12400038 | 0.495572 | 0.00196400 | 161.170 | 12400040 | 0.00117143 | 0.496365 | 165.414 |
| 4 | 12400039 | 0.495710 | 0.00182602 | 160.286 | 12400037 | 0.00000 | 0.497536 | 164.123 |