| Red | Green | Blue | |
| z | 17.64 | ||
| znorm | Inf | ||
| sky | -Inf | -Inf | -Inf |
| S/N | 24.7 | 43.5 | 46.8 |
| S/N(c) | 0.0 | 0.0 | 0.0 |
| SN(E/C) |
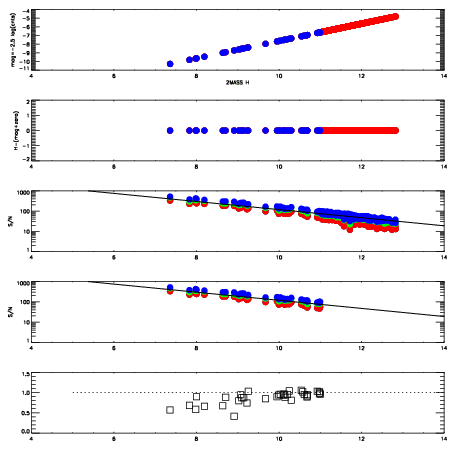
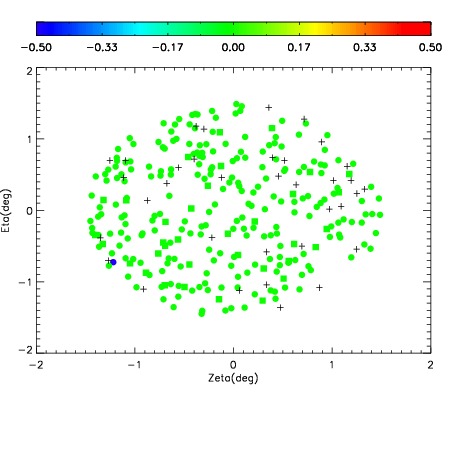
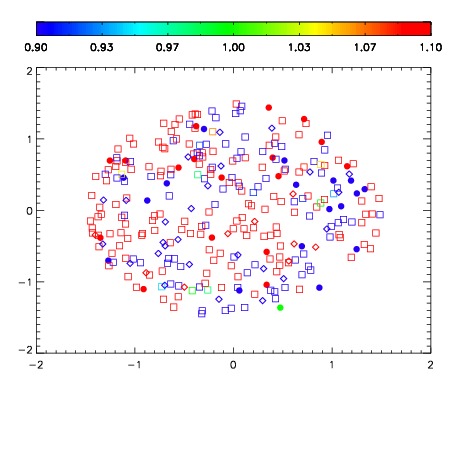
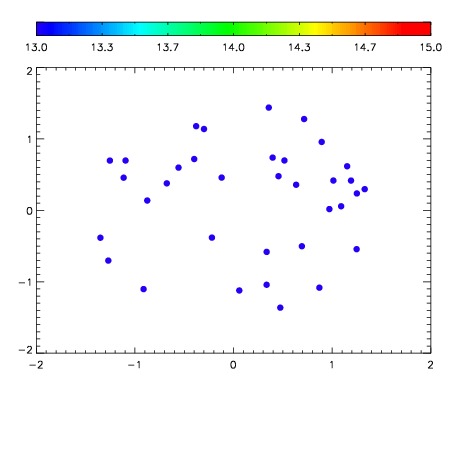

| Frame | Nreads | Zeropoints | Mag plots | Spatial mag deviation | Spatial sky 16325A emission deviations (filled: sky, open: star) | Spatial sky continuum emission | Spatial sky telluric CO2 absorption deviations (filled: H < 10) | |||||||||||||||||||||||
| 0 | 0 |
|
|
|
|
|
|
| IPAIR | NAME | SHIFT | NEWSHIFT | S/N | NAME | SHIFT | NEWSHIFT | S/N |
| 0 | 12210039 | 0.498846 | 0.00000 | 151.319 | 12210040 | -0.000145851 | 0.498992 | 148.653 |
| 1 | 12210042 | 0.497531 | 0.00131500 | 152.315 | 12210044 | -0.00136176 | 0.500208 | 152.012 |
| 2 | 12210043 | 0.498367 | 0.000478983 | 149.461 | 12210041 | -0.000267034 | 0.499113 | 146.490 |
| 3 | 12210038 | 0.498027 | 0.000818998 | 145.947 | 12210037 | 0.00000 | 0.498846 | 146.288 |