| Red | Green | Blue | |
| z | 17.64 | ||
| znorm | Inf | ||
| sky | -NaN | -NaN | -Inf |
| S/N | 27.8 | 44.4 | 48.8 |
| S/N(c) | 0.0 | 0.0 | 0.0 |
| SN(E/C) |
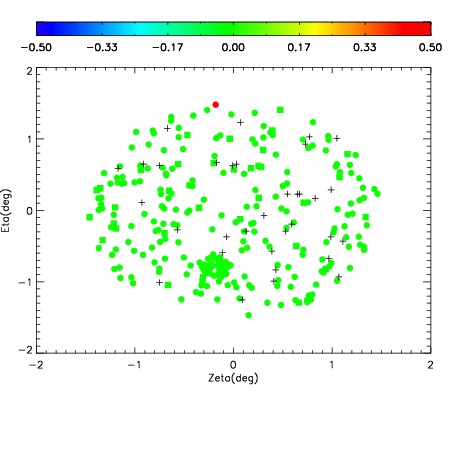
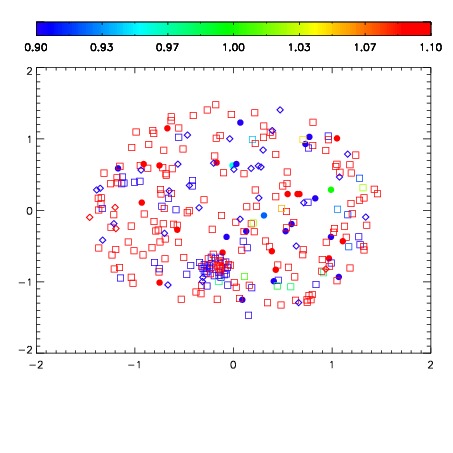
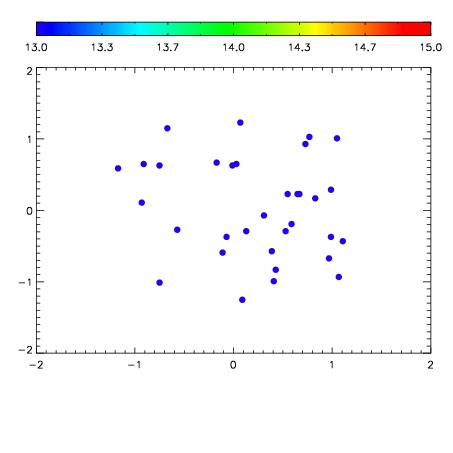

| Frame | Nreads | Zeropoints | Mag plots | Spatial mag deviation | Spatial sky 16325A emission deviations (filled: sky, open: star) | Spatial sky continuum emission | Spatial sky telluric CO2 absorption deviations (filled: H < 10) | |||||||||||||||||||||||
| 0 | 0 |
|
|
|
|
|
|
| IPAIR | NAME | SHIFT | NEWSHIFT | S/N | NAME | SHIFT | NEWSHIFT | S/N |
| 0 | 12250065 | 0.500783 | 0.00000 | 214.481 | 12250066 | -0.000194357 | 0.500977 | 214.429 |
| 1 | 12250061 | 0.496264 | 0.00451902 | 210.695 | 12250062 | 0.000299297 | 0.500484 | 206.950 |
| 2 | 12250064 | 0.500604 | 0.000179052 | 205.494 | 12250063 | 0.00105946 | 0.499724 | 205.361 |
| 3 | 12250060 | 0.494737 | 0.00604603 | 198.053 | 12250059 | 0.00000 | 0.500783 | 187.530 |