| Red | Green | Blue | |
| z | 17.65 | ||
| znorm | Inf | ||
| sky | -Inf | -Inf | -Inf |
| S/N | 9.4 | 14.2 | 16.6 |
| S/N(c) | 0.0 | 0.0 | 0.0 |
| SN(E/C) |
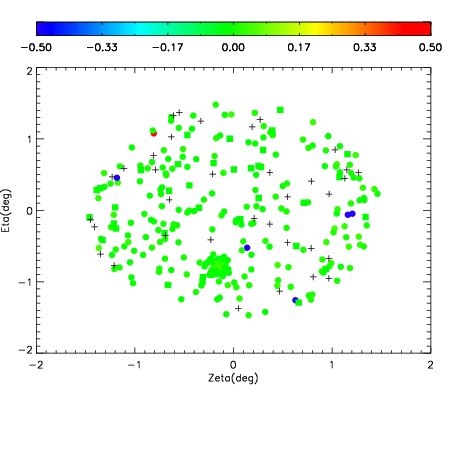
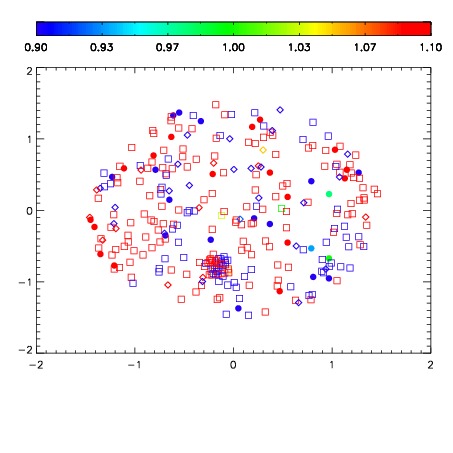
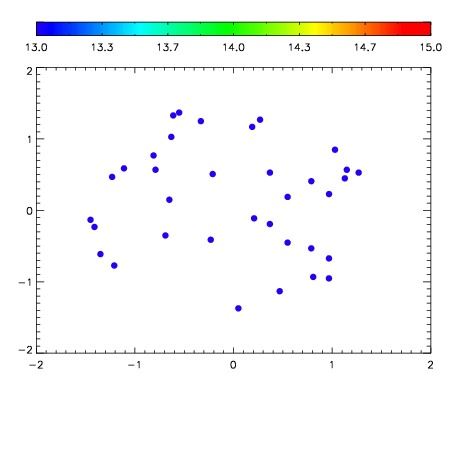

| Frame | Nreads | Zeropoints | Mag plots | Spatial mag deviation | Spatial sky 16325A emission deviations (filled: sky, open: star) | Spatial sky continuum emission | Spatial sky telluric CO2 absorption deviations (filled: H < 10) | |||||||||||||||||||||||
| 0 | 0 |
|
|
|
|
|
|
| IPAIR | NAME | SHIFT | NEWSHIFT | S/N | NAME | SHIFT | NEWSHIFT | S/N |
| 0 | 12330028 | 0.494380 | 0.00000 | 127.038 | 12330022 | 0.00000 | 0.494380 | 117.837 |
| 1 | 12330023 | 0.492146 | 0.00223401 | 125.782 | 12330025 | -0.00226770 | 0.496648 | 113.014 |
| 2 | 12330024 | 0.492401 | 0.00197899 | 124.551 | 12330026 | -0.00291032 | 0.497290 | 107.156 |
| 3 | 12330027 | 0.494068 | 0.000312001 | 117.624 | 12330029 | -0.00356480 | 0.497945 | 79.3276 |