| Red | Green | Blue | |
| z | 17.65 | ||
| znorm | Inf | ||
| sky | -Inf | -Inf | -Inf |
| S/N | 10.8 | 20.6 | 19.5 |
| S/N(c) | 0.0 | 0.0 | 0.0 |
| SN(E/C) |
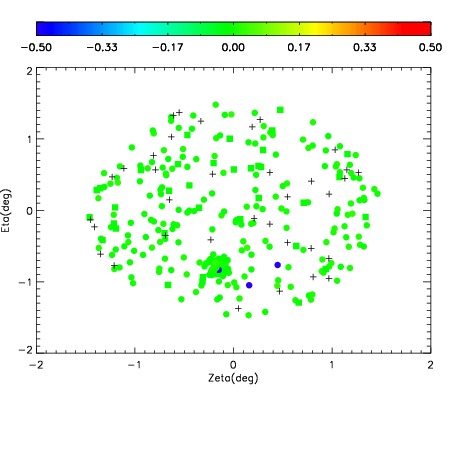
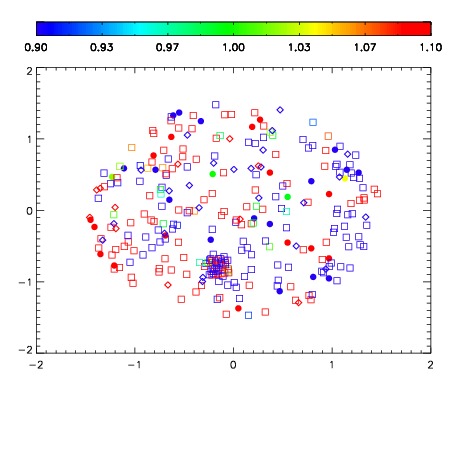
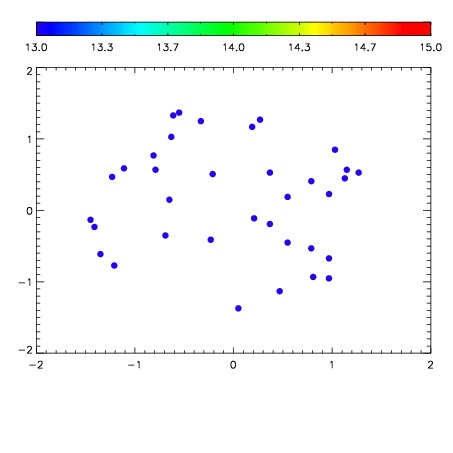

| Frame | Nreads | Zeropoints | Mag plots | Spatial mag deviation | Spatial sky 16325A emission deviations (filled: sky, open: star) | Spatial sky continuum emission | Spatial sky telluric CO2 absorption deviations (filled: H < 10) | |||||||||||||||||||||||
| 0 | 0 |
|
|
|
|
|
|
| IPAIR | NAME | SHIFT | NEWSHIFT | S/N | NAME | SHIFT | NEWSHIFT | S/N |
| 0 | 12440013 | 0.491898 | 0.00000 | 89.6077 | 12440014 | 0.00274504 | 0.489153 | 60.5890 |
| 1 | 12440017 | 0.490496 | 0.00140199 | 135.427 | 12440018 | -0.00242349 | 0.494321 | 160.678 |
| 2 | 12440012 | 0.491064 | 0.000833988 | 107.562 | 12440011 | 0.00000 | 0.491898 | 123.889 |
| 3 | 12440016 | 0.490919 | 0.000979006 | 106.193 | 12440015 | 0.00237171 | 0.489526 | 66.9679 |