| Red | Green | Blue | |
| z | 17.64 | ||
| znorm | Inf | ||
| sky | -NaN | -Inf | -Inf |
| S/N | 25.3 | 42.2 | 41.3 |
| S/N(c) | 0.0 | 0.0 | 0.0 |
| SN(E/C) |

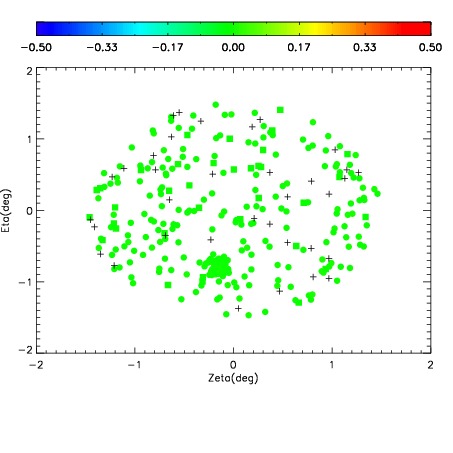
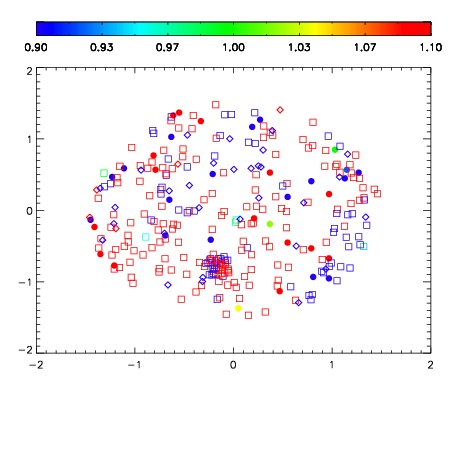
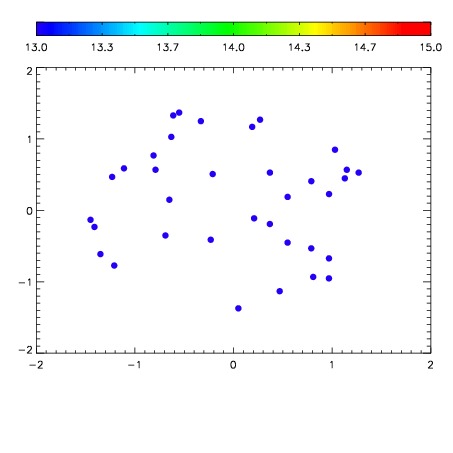

| Frame | Nreads | Zeropoints | Mag plots | Spatial mag deviation | Spatial sky 16325A emission deviations (filled: sky, open: star) | Spatial sky continuum emission | Spatial sky telluric CO2 absorption deviations (filled: H < 10) | |||||||||||||||||||||||
| 0 | 0 |
|
|
|
|
|
|
| IPAIR | NAME | SHIFT | NEWSHIFT | S/N | NAME | SHIFT | NEWSHIFT | S/N |
| 0 | 12480017 | 0.498726 | 0.00000 | 211.857 | 12480015 | -0.000977311 | 0.499703 | 213.288 |
| 1 | 12480016 | 0.498592 | 0.000134021 | 214.269 | 12480018 | -0.000722935 | 0.499449 | 218.618 |
| 2 | 12480012 | 0.494638 | 0.00408801 | 205.127 | 12480014 | -0.00153126 | 0.500257 | 207.826 |
| 3 | 12480013 | 0.495462 | 0.00326401 | 202.694 | 12480011 | 0.00000 | 0.498726 | 193.115 |