| Frame | Nreads | Zeropoints | Mag plots
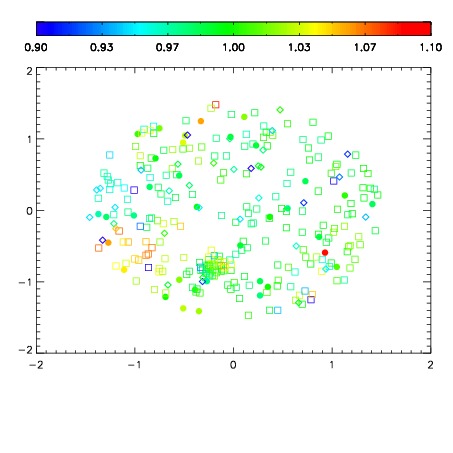
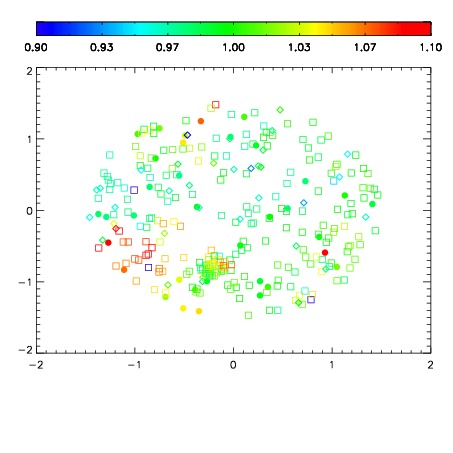
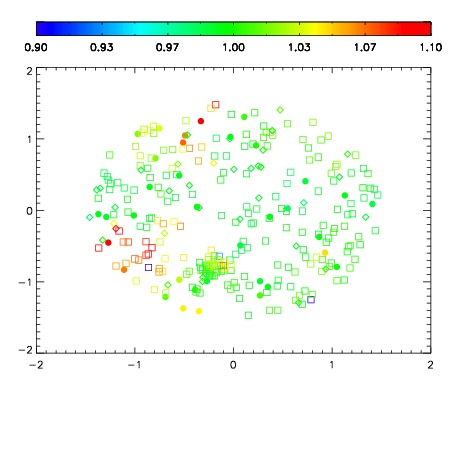
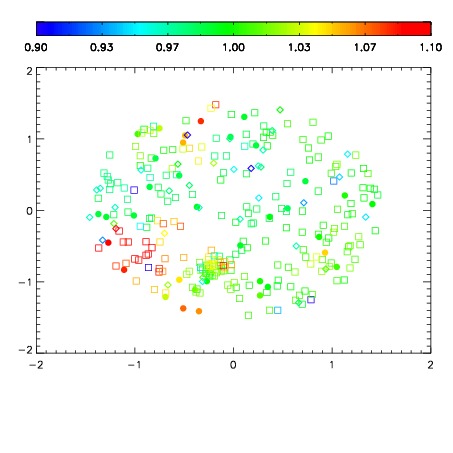
| Spatial mag deviation
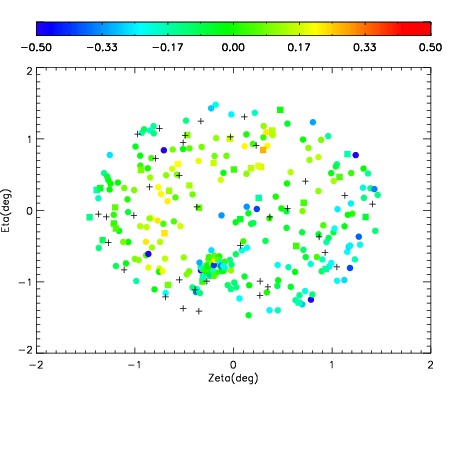
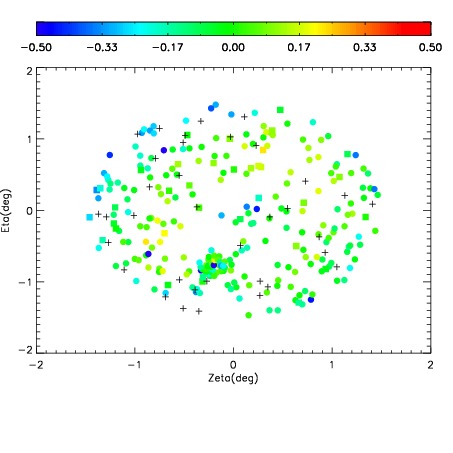
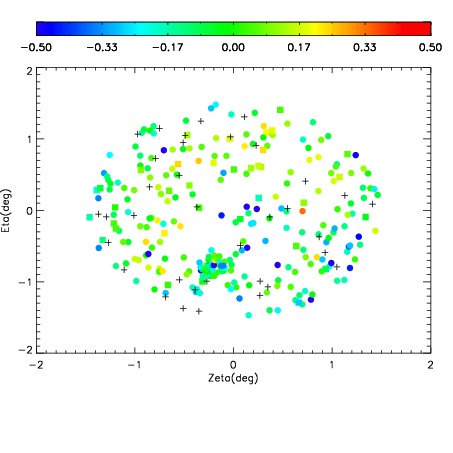
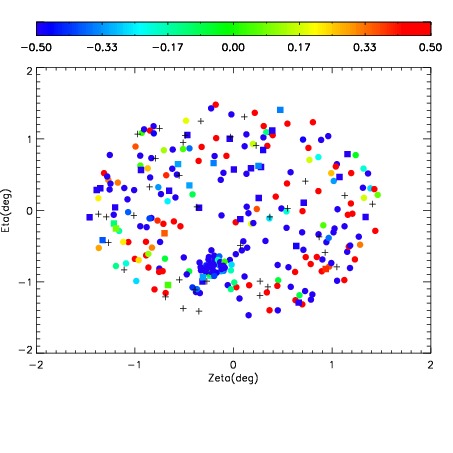
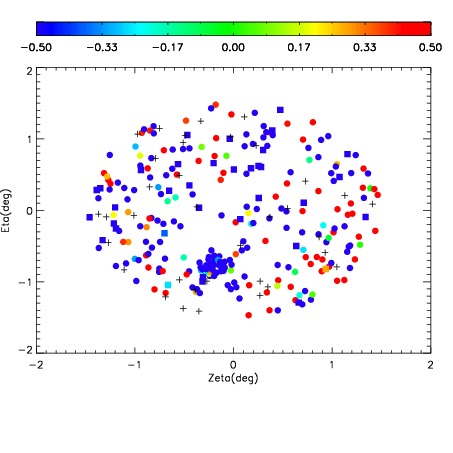
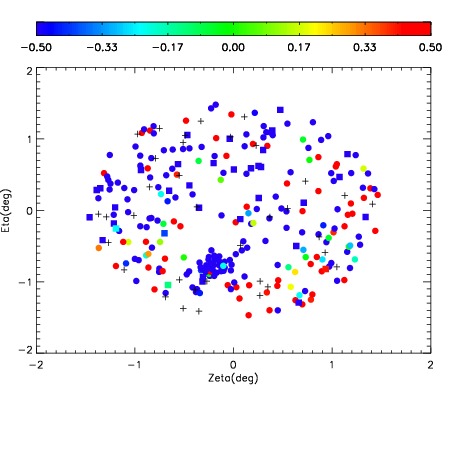
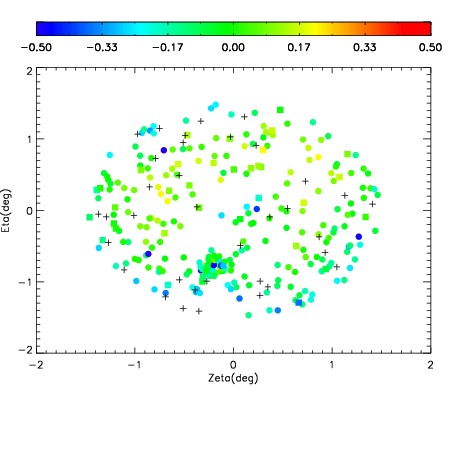
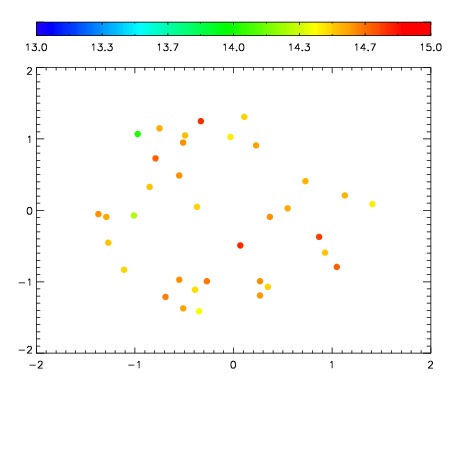
| Spatial sky 16325A emission deviations (filled: sky, open: star)
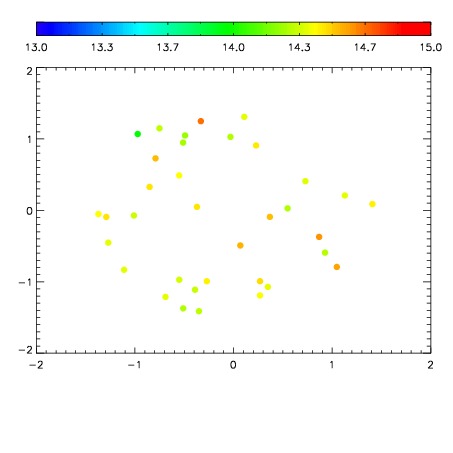
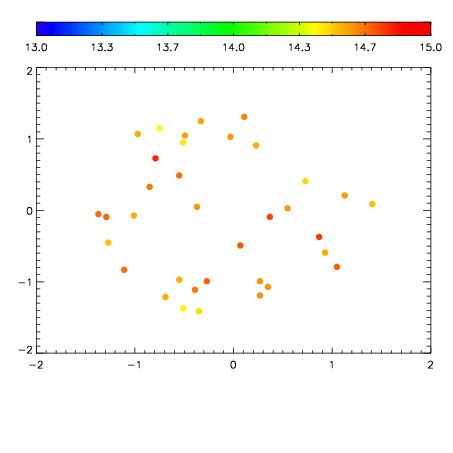
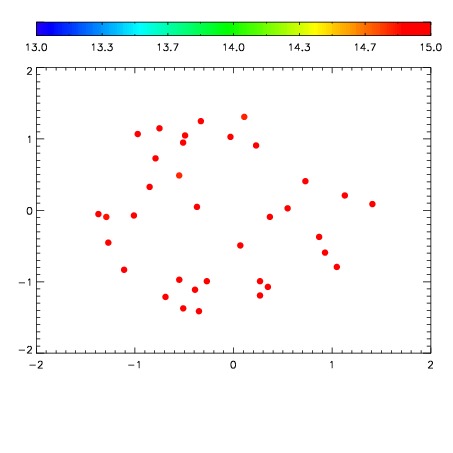
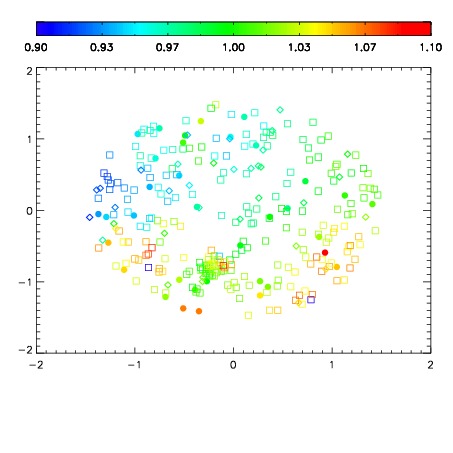
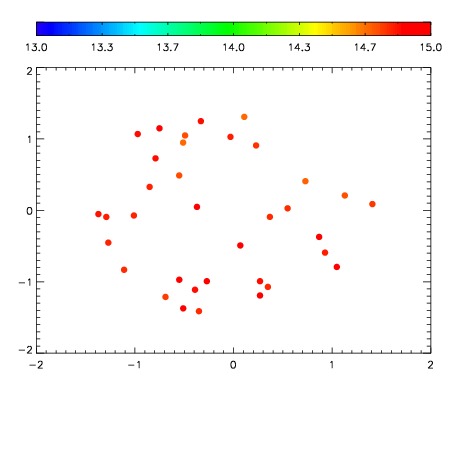
| Spatial sky continuum emission
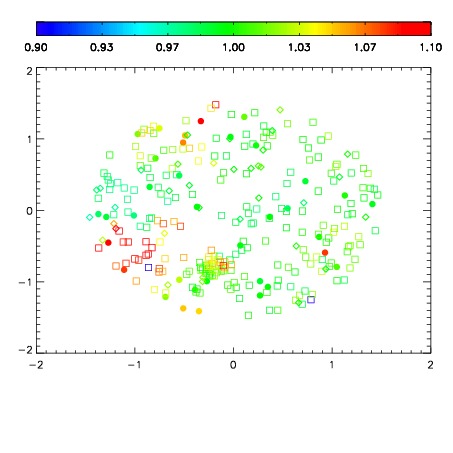
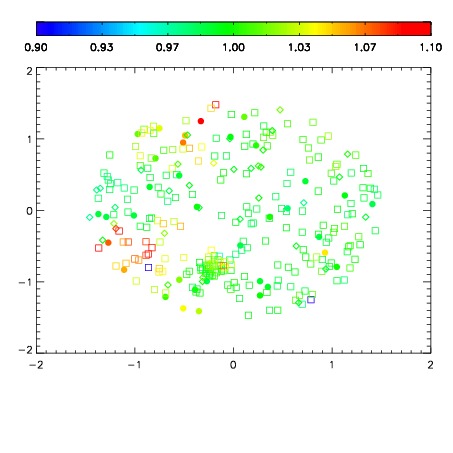
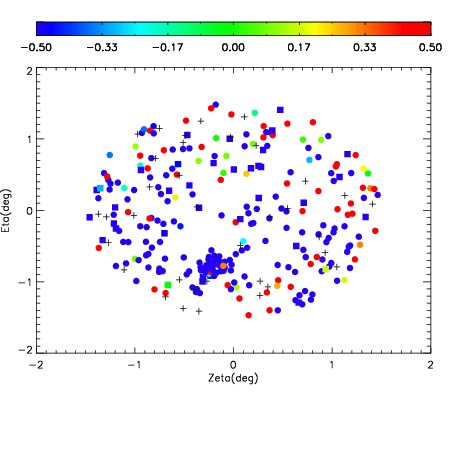
| Spatial sky telluric CO2 absorption deviations (filled: H < 10)
|
| 12220022
| 47
| | Red | Green | Blue
| | z | | 18.71
| | znorm | | 14.53
| | sky | 14.9 | 14.4 | 14.4
| | S/N | 14.0 | 20.4 | 19.5
| | S/N(c) | 12.5 | 18.9 | 17.7
| | SN(E/C) 0.78
|
| 
| 
| 
| 
| 
|
| 12220023
| 47
| | Red | Green | Blue
| | z | | 18.15
| | znorm | | 13.96
| | sky | 14.7 | 14.6 | 14.9
| | S/N | 9.2 | 14.5 | 14.1
| | S/N(c) | 8.1 | 12.8 | 12.6
| | SN(E/C) 0.86
|
| 
| 
| 
| 
| 
|
| 12220024
| 47
| | Red | Green | Blue
| | z | | 17.06
| | znorm | | 12.88
| | sky | 14.7 | 14.6 | 15.0
| | S/N | 3.6 | 7.3 | 7.1
| | S/N(c) | 3.2 | 6.4 | 6.2
| | SN(E/C) 0.85
|
| 
| 
| 
| 
| 
|
| 12220025
| 47
| | Red | Green | Blue
| | z | | 13.87
| | znorm | | 9.69
| | sky | 15.3 | 15.2 | 15.7
| | S/N | 0.2 | 0.6 | 0.4
| | S/N(c) | 0.0 | 0.0 | 0.0
| | SN(E/C) 0.76
|
| 
| 
| 
| 
| 
|
| 12220026
| 47
| | Red | Green | Blue
| | z | | 13.48
| | znorm | | 9.30
| | sky | 15.1 | 15.0 | 15.4
| | S/N | 0.1 | 0.4 | 0.4
| | S/N(c) | 0.0 | 0.0 | 0.0
| | SN(E/C) 1.36
|
| 
| 
| 
| 
| 
|
| 12220027
| 47
| | Red | Green | Blue
| | z | | 13.29
| | znorm | | 9.11
| | sky | 15.2 | 15.0 | 15.5
| | S/N | -0.0 | 0.2 | 0.2
| | S/N(c) | 0.0 | 0.0 | 0.0
| | SN(E/C) 1.66
|
| 
| 
| 
| 
| 
|
| 12220028
| 47
| | Red | Green | Blue
| | z | | 13.17
| | znorm | | 8.99
| | sky | 15.0 | 14.8 | 15.4
| | S/N | 0.1 | 0.3 | 0.0
| | S/N(c) | 0.0 | 0.0 | 0.0
| | SN(E/C) 1.49
|
| 
| 
| 
| 
| 
|
| 12220029
| 47
| | Red | Green | Blue
| | z | | 18.69
| | znorm | | 14.51
| | sky | 14.6 | 14.6 | 14.7
| | S/N | 13.1 | 20.5 | 20.6
| | S/N(c) | 11.3 | 18.5 | 18.4
| | SN(E/C) 0.80
|
| 
| 
| 
| 
| 
|