| Red | Green | Blue | |
| z | 17.64 | ||
| znorm | Inf | ||
| sky | -NaN | -NaN | -Inf |
| S/N | 26.2 | 42.6 | 42.0 |
| S/N(c) | 0.0 | 0.0 | 0.0 |
| SN(E/C) |

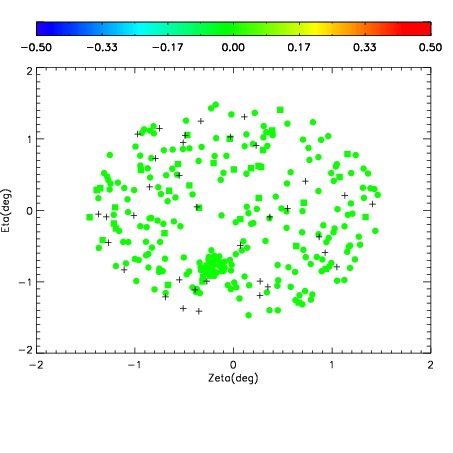
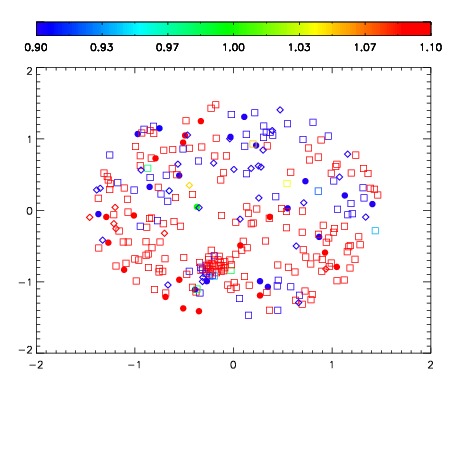
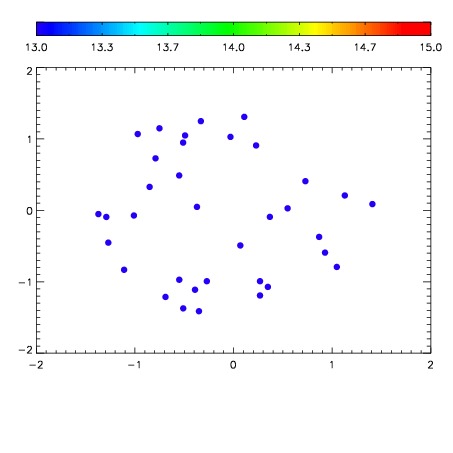

| Frame | Nreads | Zeropoints | Mag plots | Spatial mag deviation | Spatial sky 16325A emission deviations (filled: sky, open: star) | Spatial sky continuum emission | Spatial sky telluric CO2 absorption deviations (filled: H < 10) | |||||||||||||||||||||||
| 0 | 0 |
|
|
|
|
|
|
| IPAIR | NAME | SHIFT | NEWSHIFT | S/N | NAME | SHIFT | NEWSHIFT | S/N |
| 0 | 12230043 | 0.494221 | 0.00000 | 201.964 | 12230044 | -0.00191224 | 0.496133 | 201.887 |
| 1 | 12230042 | 0.493315 | 0.000905991 | 201.013 | 12230041 | -0.00290598 | 0.497127 | 197.135 |
| 2 | 12230039 | 0.494089 | 0.000131994 | 191.141 | 12230040 | -0.00294444 | 0.497165 | 196.695 |
| 3 | 12230038 | 0.493827 | 0.000394017 | 187.971 | 12230037 | 0.00000 | 0.494221 | 169.540 |