| Red | Green | Blue | |
| z | 17.64 | ||
| znorm | Inf | ||
| sky | -NaN | -NaN | -Inf |
| S/N | 22.7 | 31.5 | 30.4 |
| S/N(c) | 0.0 | 0.0 | 0.0 |
| SN(E/C) |
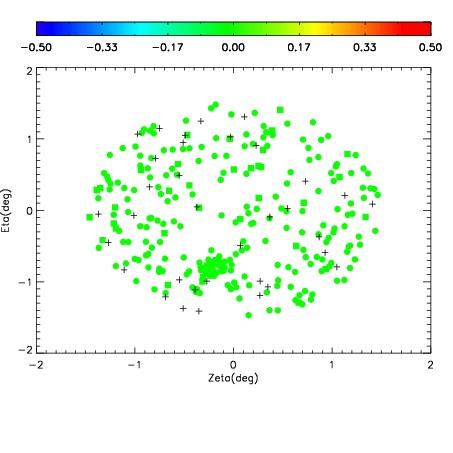
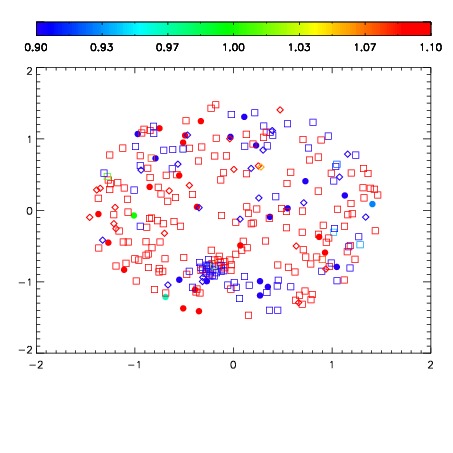
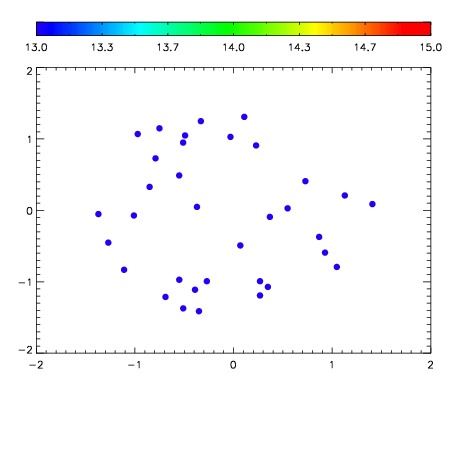

| Frame | Nreads | Zeropoints | Mag plots | Spatial mag deviation | Spatial sky 16325A emission deviations (filled: sky, open: star) | Spatial sky continuum emission | Spatial sky telluric CO2 absorption deviations (filled: H < 10) | |||||||||||||||||||||||
| 0 | 0 |
|
|
|
|
|
|
| IPAIR | NAME | SHIFT | NEWSHIFT | S/N | NAME | SHIFT | NEWSHIFT | S/N |
| 0 | 12310045 | 0.493088 | 0.00000 | 106.097 | 12310044 | 0.00000 | 0.493088 | 85.8518 |
| 1 | 12310050 | 0.492074 | 0.00101399 | 194.038 | 12310051 | -0.00395978 | 0.497048 | 197.799 |
| 2 | 12310049 | 0.491706 | 0.00138199 | 185.170 | 12310048 | -0.00192578 | 0.495014 | 166.915 |
| 3 | 12310046 | 0.492580 | 0.000508010 | 112.336 | 12310047 | -0.00174139 | 0.494829 | 143.198 |