| Red | Green | Blue | |
| z | 17.64 | ||
| znorm | Inf | ||
| sky | -NaN | -NaN | -Inf |
| S/N | 28.3 | 41.2 | 38.5 |
| S/N(c) | 0.0 | 0.0 | 0.0 |
| SN(E/C) |
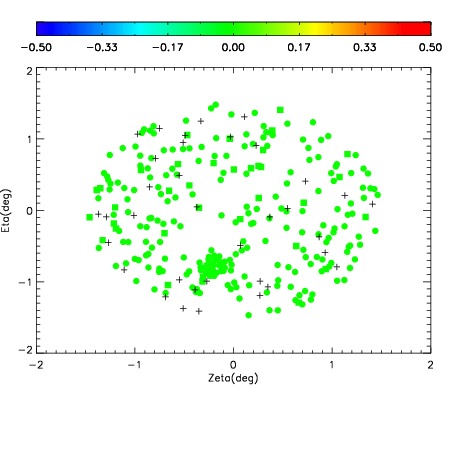
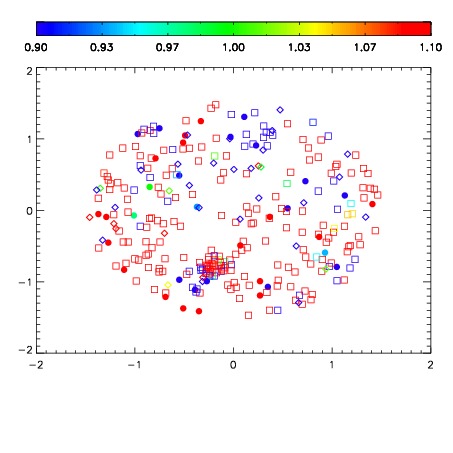
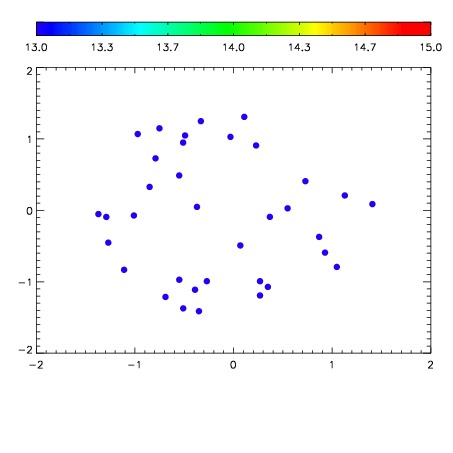

| Frame | Nreads | Zeropoints | Mag plots | Spatial mag deviation | Spatial sky 16325A emission deviations (filled: sky, open: star) | Spatial sky continuum emission | Spatial sky telluric CO2 absorption deviations (filled: H < 10) | |||||||||||||||||||||||
| 0 | 0 |
|
|
|
|
|
|
| IPAIR | NAME | SHIFT | NEWSHIFT | S/N | NAME | SHIFT | NEWSHIFT | S/N |
| 0 | 12370027 | 0.491778 | 0.00000 | 168.659 | 12370026 | 0.00252643 | 0.489252 | 171.245 |
| 1 | 12370028 | 0.491678 | 9.99868e-05 | 217.720 | 12370022 | 0.00000 | 0.491778 | 213.383 |
| 2 | 12370023 | 0.488792 | 0.00298598 | 205.470 | 12370029 | 0.00207963 | 0.489698 | 211.493 |
| 3 | 12370024 | 0.489855 | 0.00192299 | 191.901 | 12370025 | 0.00229617 | 0.489482 | 185.840 |