| Red | Green | Blue | |
| z | 17.64 | ||
| znorm | Inf | ||
| sky | -NaN | -Inf | -Inf |
| S/N | 23.2 | 37.9 | 56.7 |
| S/N(c) | 0.0 | 0.0 | 0.0 |
| SN(E/C) |
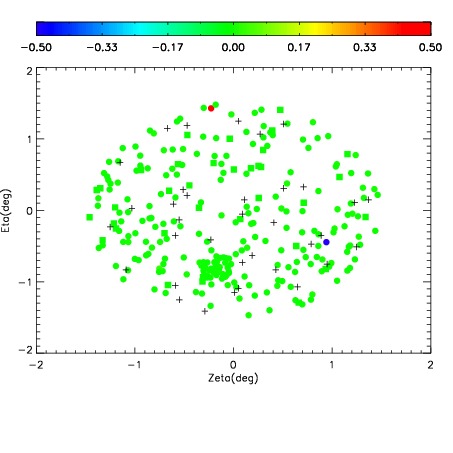
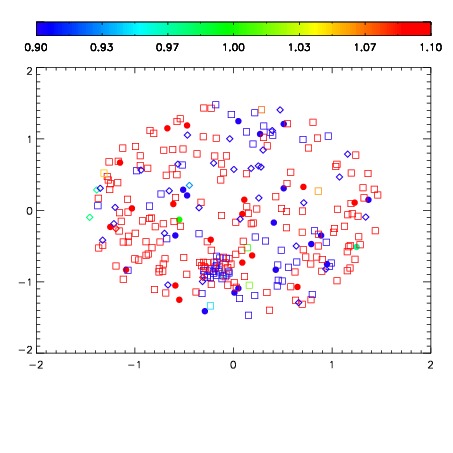


| Frame | Nreads | Zeropoints | Mag plots | Spatial mag deviation | Spatial sky 16325A emission deviations (filled: sky, open: star) | Spatial sky continuum emission | Spatial sky telluric CO2 absorption deviations (filled: H < 10) | |||||||||||||||||||||||
| 0 | 0 |
|
|
|
|
|
|
| IPAIR | NAME | SHIFT | NEWSHIFT | S/N | NAME | SHIFT | NEWSHIFT | S/N |
| 0 | 12200028 | 0.501185 | 0.00000 | 210.265 | 12200025 | -0.00274484 | 0.503930 | 213.288 |
| 1 | 12200027 | 0.500318 | 0.000867009 | 211.542 | 12200026 | -0.00231730 | 0.503502 | 218.100 |
| 2 | 12200024 | 0.500216 | 0.000968993 | 207.048 | 12200029 | 0.000897404 | 0.500288 | 209.744 |
| 3 | 12200023 | 0.500432 | 0.000752985 | 200.442 | 12200022 | 0.00000 | 0.501185 | 190.589 |