| Red | Green | Blue | |
| z | 17.64 | ||
| znorm | Inf | ||
| sky | -NaN | -Inf | -Inf |
| S/N | 21.8 | 34.1 | 44.4 |
| S/N(c) | 0.0 | 0.0 | 0.0 |
| SN(E/C) |
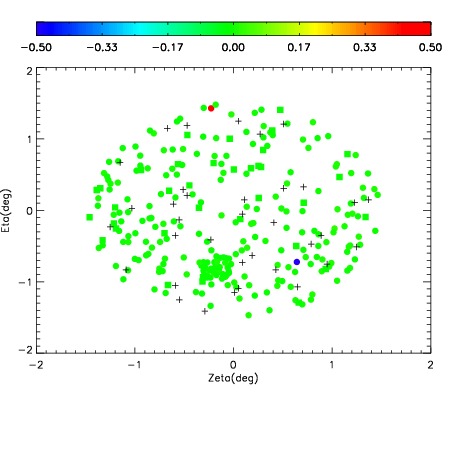
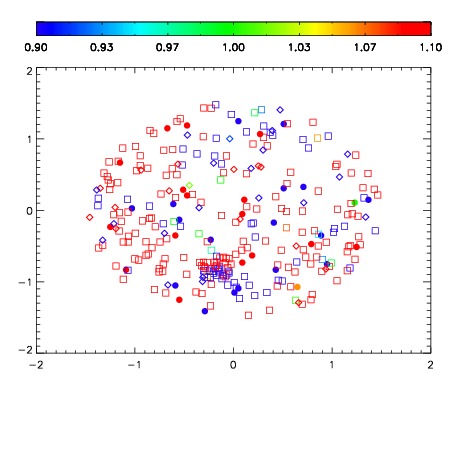
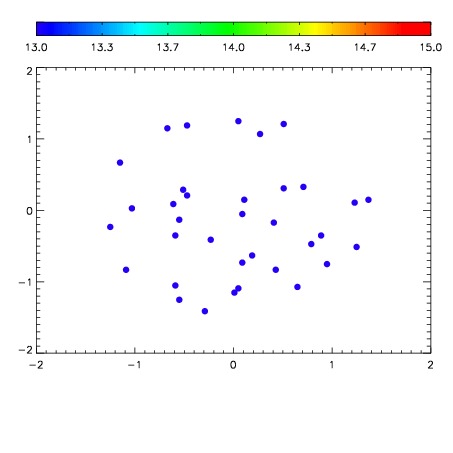

| Frame | Nreads | Zeropoints | Mag plots | Spatial mag deviation | Spatial sky 16325A emission deviations (filled: sky, open: star) | Spatial sky continuum emission | Spatial sky telluric CO2 absorption deviations (filled: H < 10) | |||||||||||||||||||||||
| 0 | 0 |
|
|
|
|
|
|
| IPAIR | NAME | SHIFT | NEWSHIFT | S/N | NAME | SHIFT | NEWSHIFT | S/N |
| 0 | 12240061 | 0.495789 | 0.00000 | 194.135 | 12240062 | 0.00284096 | 0.492948 | 196.356 |
| 1 | 12240057 | 0.493058 | 0.00273100 | 177.213 | 12240058 | 0.000179627 | 0.495609 | 188.725 |
| 2 | 12240060 | 0.495464 | 0.000324994 | 172.897 | 12240059 | 0.00111957 | 0.494669 | 166.618 |
| 3 | 12240056 | 0.492016 | 0.00377300 | 167.634 | 12240055 | 0.00000 | 0.495789 | 147.469 |